9 Q
6th

9 Q
6th

15 Q
6th - 9th

20 Q
6th

18 Q
6th

10 Q
6th

15 Q
6th

19 Q
6th - 8th

16 Q
6th

20 Q
6th

20 Q
6th - 8th

18 Q
6th

20 Q
6th

20 Q
6th - 7th

18 Q
6th

15 Q
6th - 8th

21 Q
6th - 9th

30 Q
6th

22 Q
6th

15 Q
6th

25 Q
6th

15 Q
6th

12 Q
6th - 8th

21 Q
6th - 8th
Explore Histograms Worksheets by Grades
Explore Other Subject Worksheets for year 6
Explore printable Histograms worksheets for 6th Year
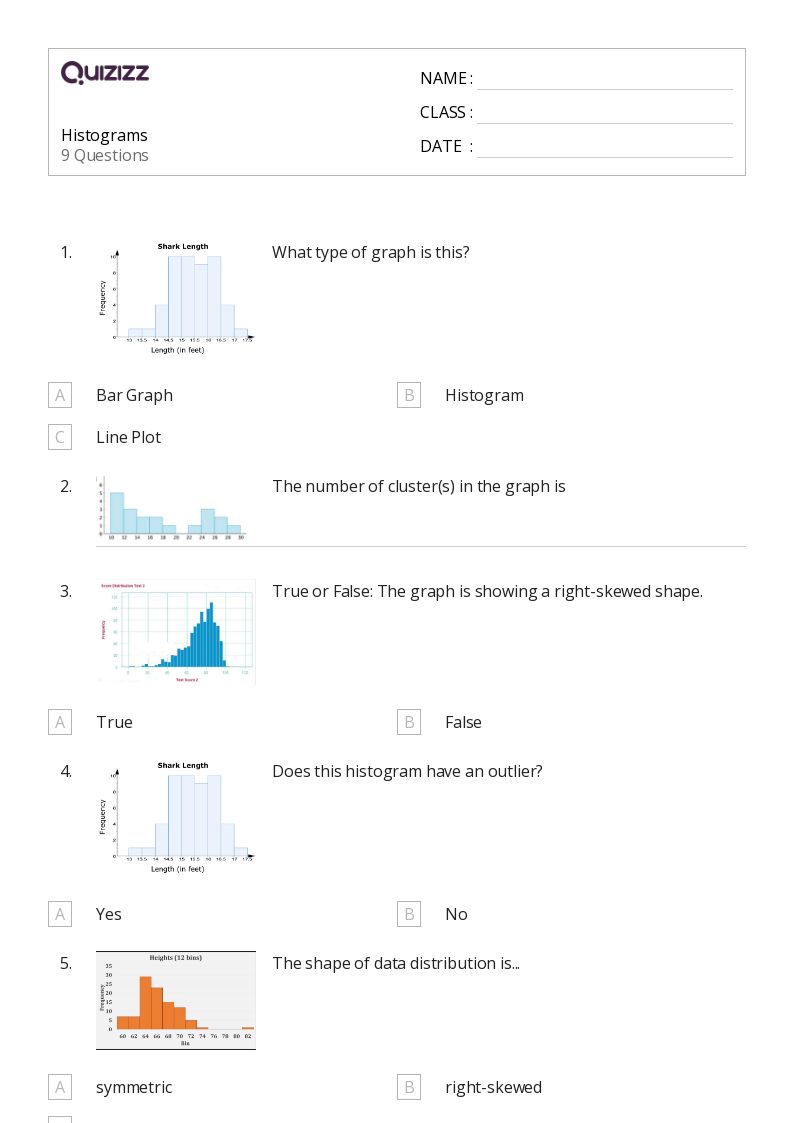
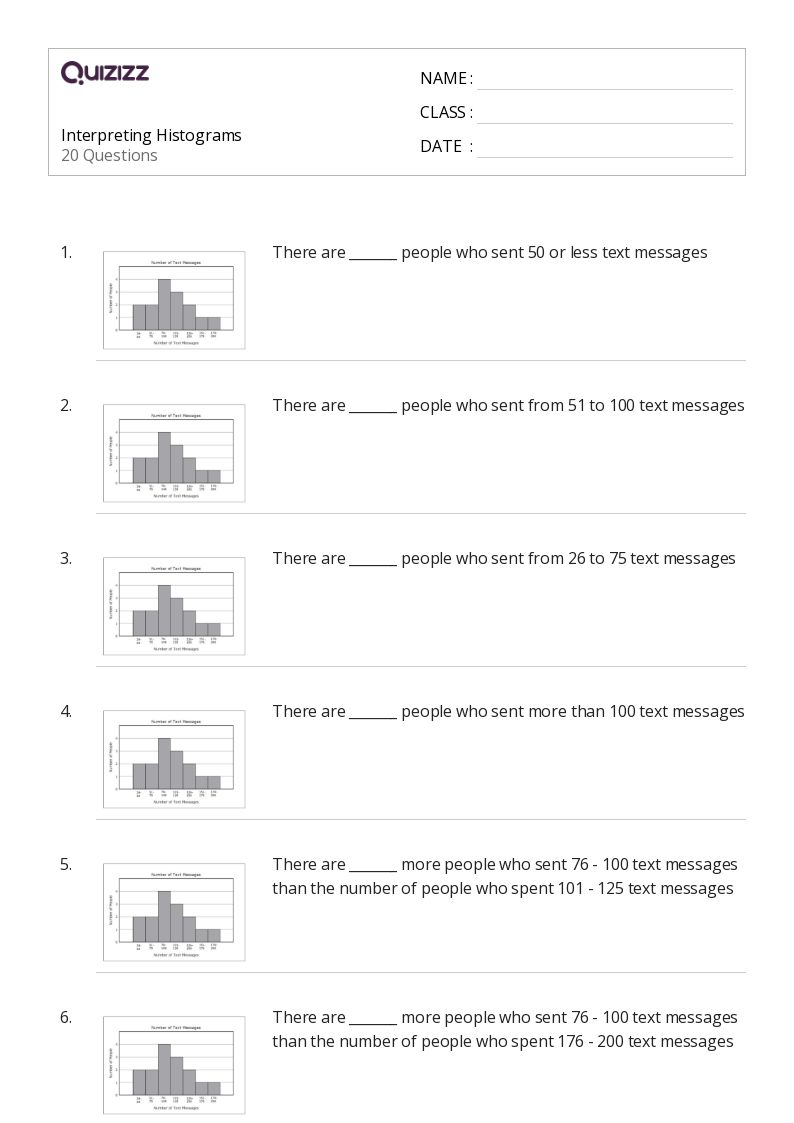
Histograms worksheets for Year 6 are an excellent resource for teachers to help their students master the concepts of math, data, and graphing. These worksheets provide a variety of activities that focus on graphing data, allowing students to practice and develop their skills in creating and interpreting histograms. As a teacher, you know how important it is to provide engaging and relevant materials for your students, and these worksheets are designed to do just that. With a range of topics covered, from analyzing frequency distributions to comparing data sets, these Year 6 histograms worksheets are an invaluable tool for teaching your students the fundamentals of data representation and analysis.
In addition to histograms worksheets for Year 6, teachers can also utilize Quizizz, an online platform that offers a wide range of interactive quizzes and activities to supplement their lessons on math, data, and graphing. Quizizz provides a fun and engaging way for students to practice their skills in graphing data, while also allowing teachers to track their progress and identify areas that may need further reinforcement. With a vast library of quizzes and resources available, teachers can easily find materials that align with their curriculum and cater to the unique needs of their Year 6 students. By incorporating both histograms worksheets and Quizizz into your teaching toolkit, you can ensure that your students have a comprehensive understanding of data and graphing concepts, setting them up for success in their future mathematical endeavors.
