8 Q
2nd

10 Q
1st - 2nd

10 Q
2nd

6 Q
2nd

8 Q
2nd - 4th

12 Q
2nd

15 Q
1st - 2nd

15 Q
1st - 2nd

17 Q
2nd - 3rd

10 Q
2nd - 3rd

15 Q
2nd

5 Q
2nd - 12th

33 Q
1st - 2nd

9 Q
2nd

10 Q
2nd - 3rd

20 Q
1st - 2nd

15 Q
2nd

15 Q
2nd - 5th

20 Q
2nd

19 Q
2nd - 5th

13 Q
2nd

10 Q
1st - 2nd

12 Q
2nd - 6th

10 Q
2nd
Explore Histograms Worksheets by Grades
Explore Other Subject Worksheets for year 2
Browse resources by Grade
Browse resources by Subject
Explore printable Histograms worksheets for 2nd Year
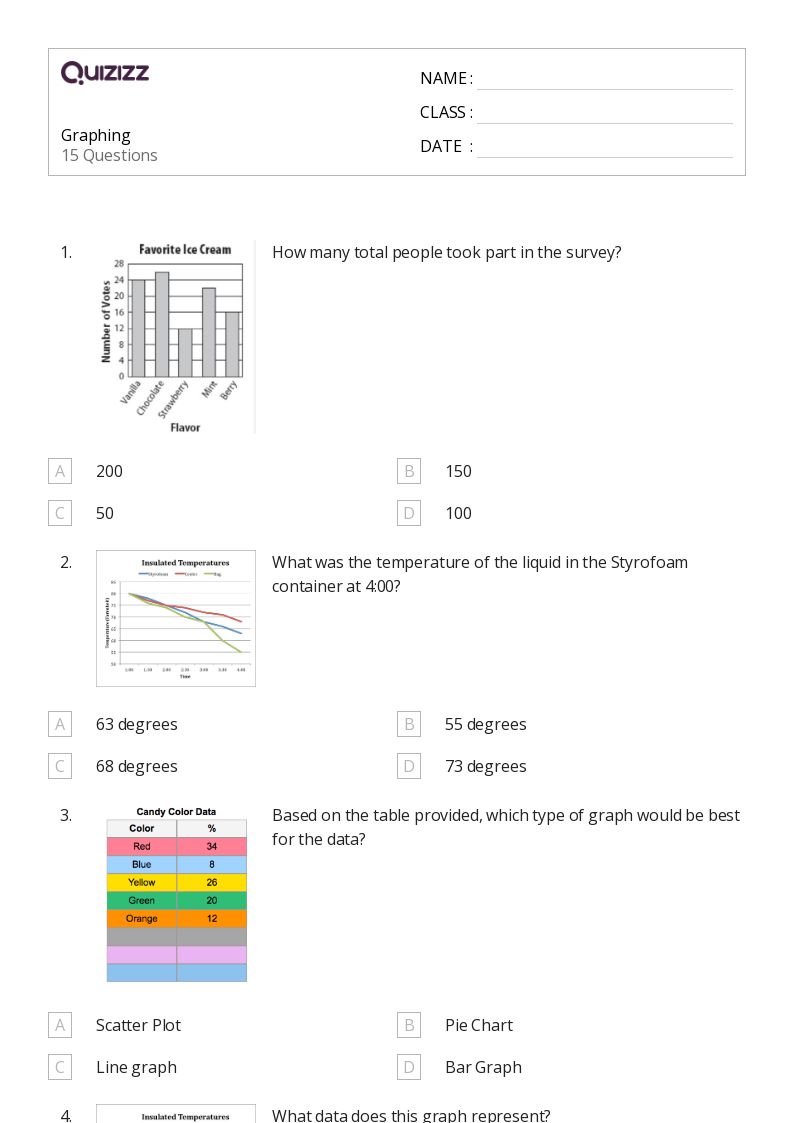
Histograms worksheets for Year 2 are an excellent resource for teachers looking to enhance their students' understanding of math, data, and graphing concepts. These worksheets provide a fun and engaging way for young learners to practice graphing data, allowing them to visualize information and make connections between numbers and real-world situations. By incorporating histograms into their lesson plans, educators can help their students develop essential skills in data analysis and interpretation. Additionally, these worksheets can be easily adapted to suit various learning styles and classroom settings, ensuring that all Year 2 students have the opportunity to excel in math, data, and graphing.
Quizizz is a fantastic platform that offers a wide range of educational resources, including histograms worksheets for Year 2 students. Teachers can utilize Quizizz to create interactive quizzes and games that not only reinforce math, data, and graphing concepts but also promote student engagement and motivation. The platform's user-friendly interface allows educators to easily customize their quizzes, tailoring them to the specific needs and abilities of their Year 2 students. Furthermore, Quizizz provides valuable insights into student performance, enabling teachers to identify areas of improvement and adjust their lesson plans accordingly. By incorporating Quizizz into their teaching strategies, educators can ensure that their Year 2 students receive a well-rounded education in math, data, and graphing.
