11 Q
2nd - 3rd

10 Q
2nd

15 Q
2nd

11 Q
2nd - 3rd

6 Q
2nd - 4th

19 Q
2nd

11 Q
2nd

10 Q
2nd

10 Q
2nd

15 Q
2nd - 4th

20 Q
2nd

10 Q
2nd

20 Q
2nd

10 Q
2nd

3 Q
2nd

62 Q
2nd

10 Q
2nd

20 Q
2nd

28 Q
2nd

25 Q
2nd

20 Q
2nd - 3rd

8 Q
2nd

25 Q
2nd - 3rd

15 Q
2nd - 3rd
Explore Line Plots Worksheets by Grades
Explore Other Subject Worksheets for year 2
Browse resources by Grade
Browse resources by Subject
Explore printable Line Plots worksheets for 2nd Year
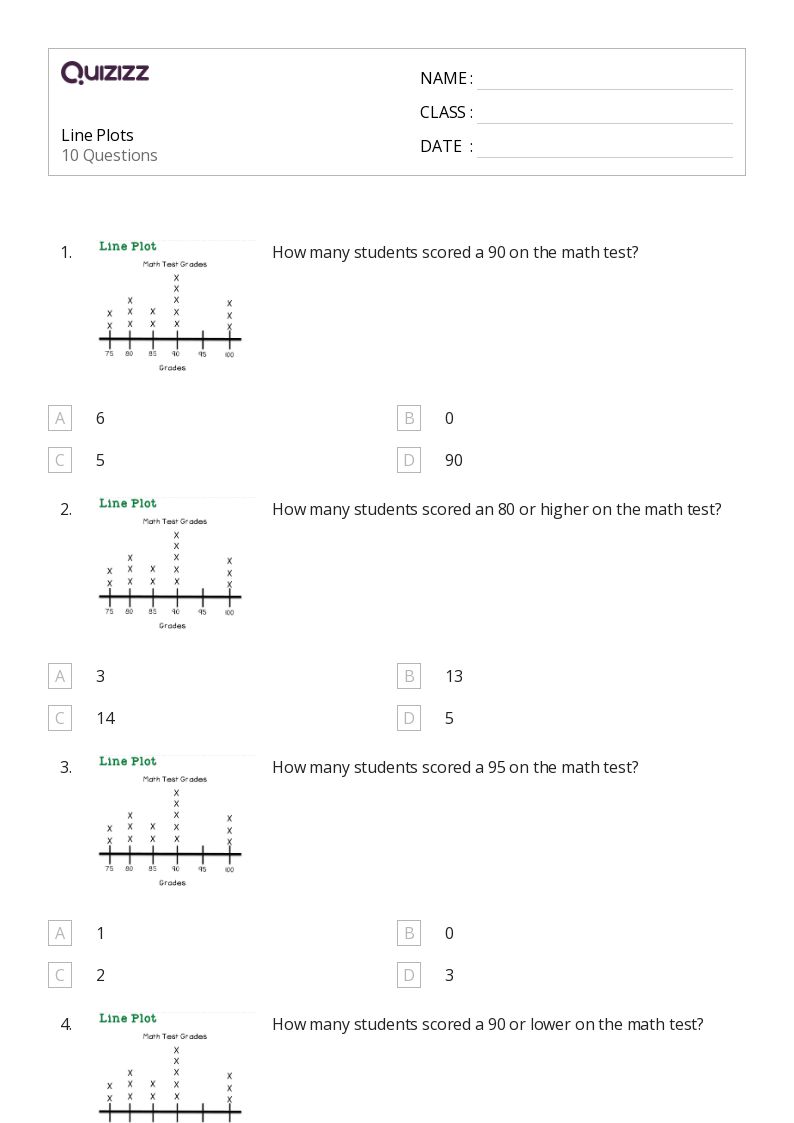
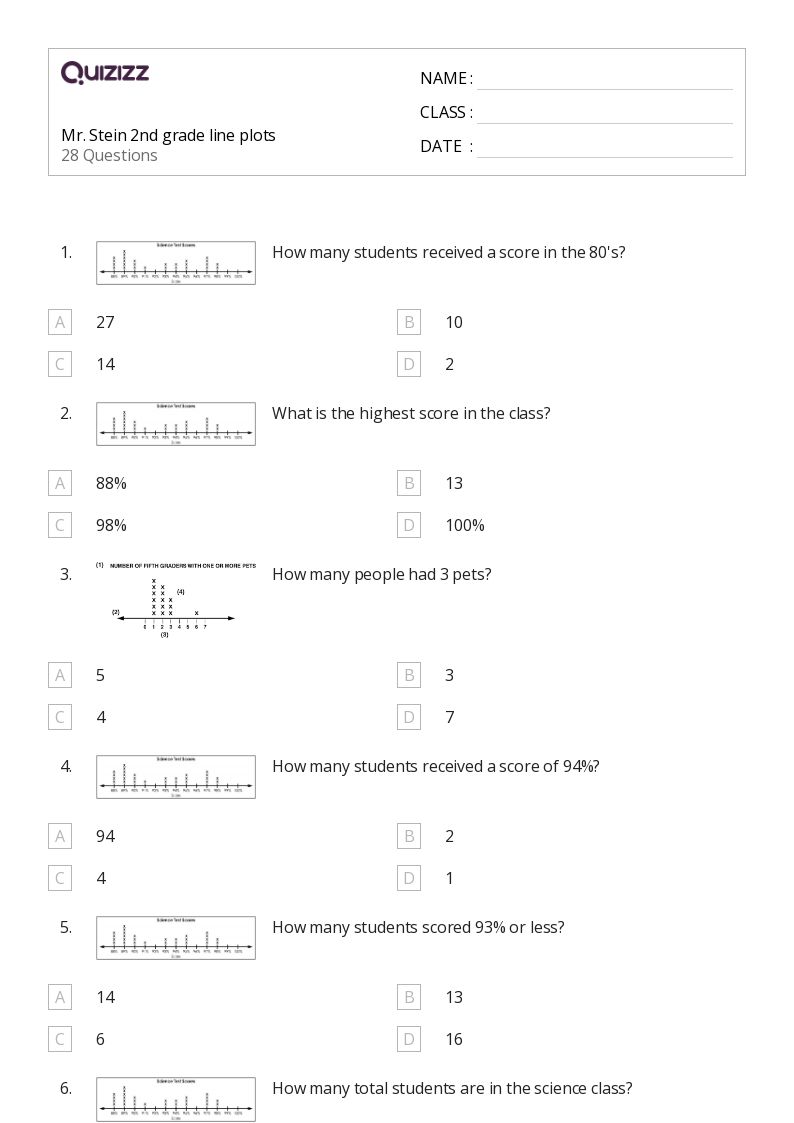
Line Plots worksheets for Year 2 are an excellent resource for teachers looking to enhance their students' understanding of math, data, and graphing concepts. These worksheets provide a variety of engaging activities that help young learners develop essential skills in organizing and interpreting data. By using line plots, students can easily visualize the distribution of data points and identify trends or patterns. Teachers can incorporate these worksheets into their lesson plans to reinforce key concepts, such as counting, measuring, and comparing data sets. With a focus on graphing data, these worksheets offer a fun and interactive way for second-grade students to build a strong foundation in math and data analysis.
Quizizz is a fantastic platform that offers a wide range of educational resources, including Line Plots worksheets for Year 2, to help teachers create engaging and interactive learning experiences for their students. In addition to worksheets, Quizizz also provides quizzes, games, and other activities that can be easily integrated into the classroom to support various learning styles. Teachers can use Quizizz to track student progress and identify areas where additional support may be needed. By incorporating these resources into their teaching strategies, educators can ensure that their second-grade students develop a solid understanding of math, data, and graphing concepts. With Quizizz, teachers can create a dynamic and engaging learning environment that fosters a love for math and data analysis in young learners.
