20 Q
6th

21 Q
6th - 8th

20 Q
6th - 12th

24 Q
6th - 8th

20 Q
6th - 8th

25 Q
6th - 7th

20 Q
6th - 8th

20 Q
6th - 11th

11 Q
6th - 9th

12 Q
6th - 12th

99 Q
6th

13 Q
6th

20 Q
6th - 8th

20 Q
6th

10 Q
6th

28 Q
6th - 11th

19 Q
6th

25 Q
6th

10 Q
6th - 8th

10 Q
6th

10 Q
6th - 8th

6 Q
4th - 6th
Explore Interpreting Graphs Worksheets by Grades
Explore Other Subject Worksheets for year 6
Explore printable Interpreting Graphs worksheets for 6th Year
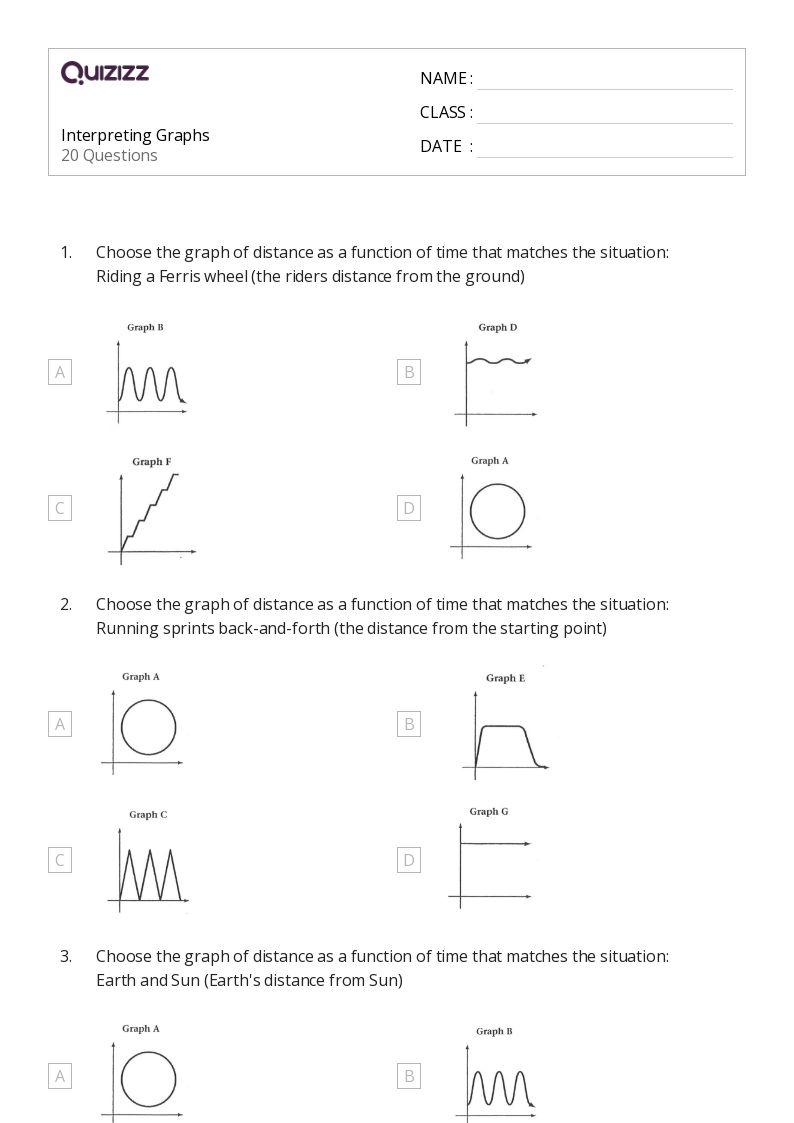
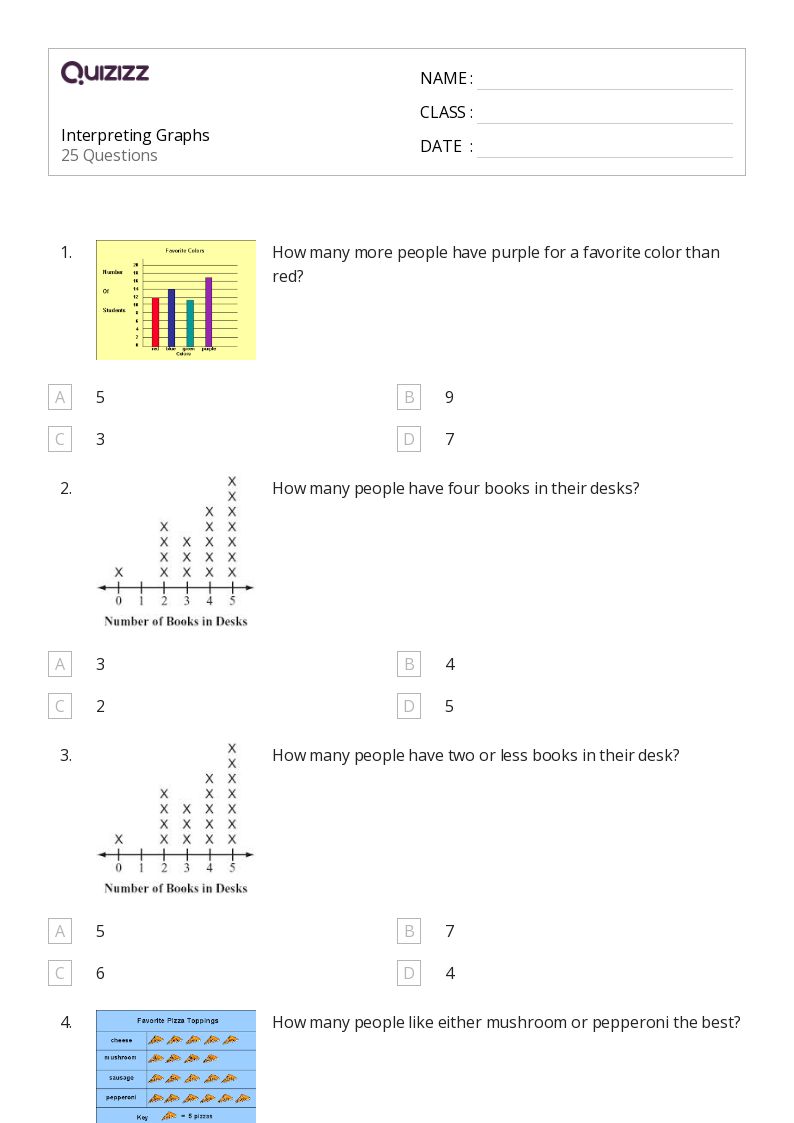
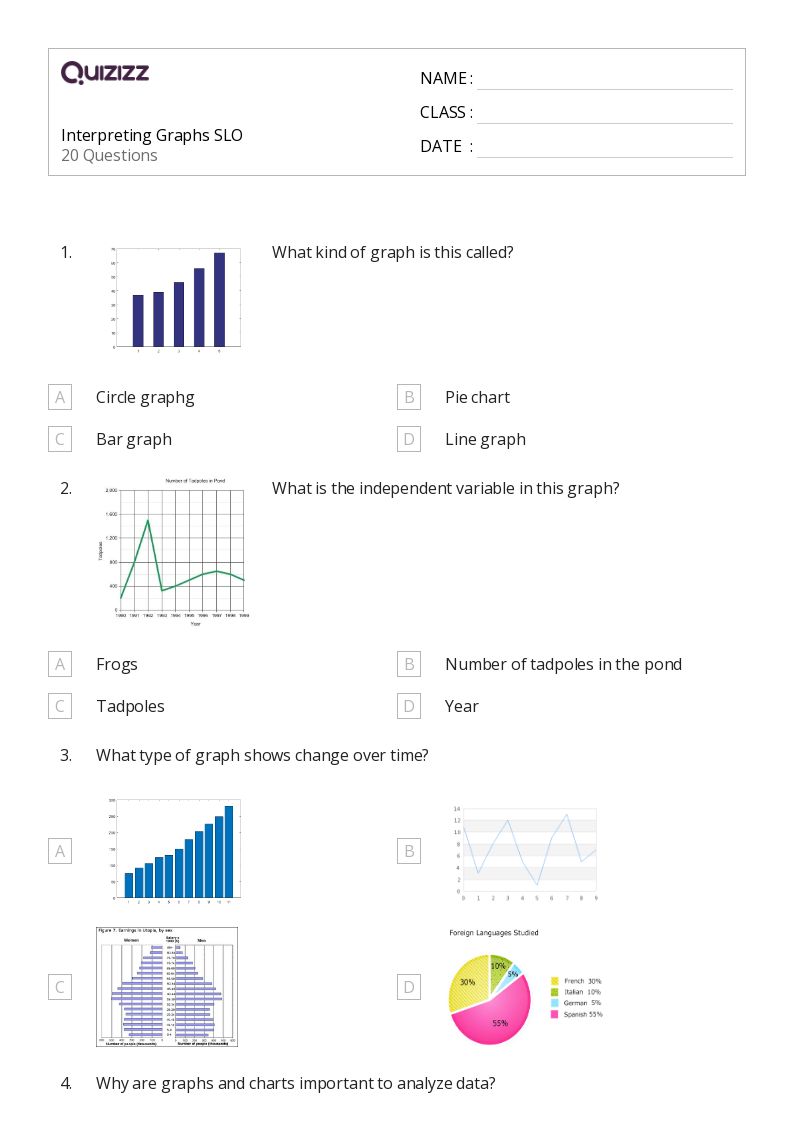
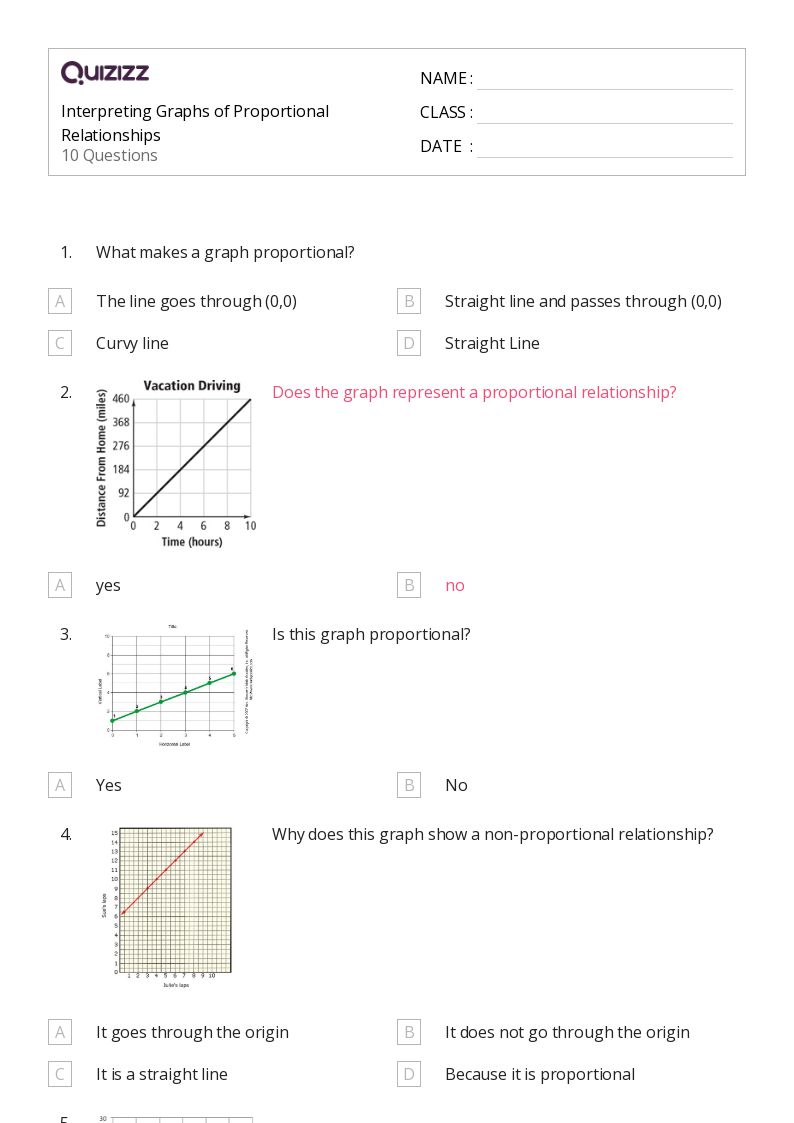
Interpreting Graphs worksheets for Year 6 are essential tools for teachers to help their students develop a strong foundation in math, specifically in the area of data and graphing. These worksheets are designed to engage and challenge sixth-grade students in understanding various types of graphs, such as bar graphs, line graphs, and pie charts. By incorporating these worksheets into their lesson plans, teachers can effectively teach students how to analyze and interpret data presented in graphical form. Additionally, these worksheets provide ample opportunities for students to practice their graphing skills, ensuring they become proficient in reading and interpreting graphs, a crucial skill for success in higher-level math courses.
In addition to Interpreting Graphs worksheets for Year 6, teachers can also utilize Quizizz, an online platform that offers a wide range of interactive quizzes and games to supplement their classroom instruction. Quizizz not only provides engaging content related to math, data, and graphing, but also covers various other subjects and topics, making it a versatile resource for educators. By incorporating Quizizz into their teaching strategies, teachers can create a more dynamic and interactive learning environment, helping students to better retain information and develop a deeper understanding of the material. Furthermore, Quizizz allows teachers to track student progress and identify areas where additional support may be needed, ensuring that every student has the opportunity to succeed in mastering the essential skills of graphing data.
