17 Q
7th

15 Q
7th

10 Q
7th

21 Q
6th - 7th

15 Q
5th - 7th

6 Q
7th

5 Q
7th

41 Q
7th

10 Q
5th - 7th

13 Q
7th

10 Q
7th

13 Q
4th - 7th

15 Q
7th

10 Q
7th - 9th

33 Q
7th

14 Q
7th

20 Q
7th

10 Q
6th - 7th

20 Q
6th - 7th

26 Q
5th - 7th

10 Q
7th

25 Q
6th - 7th

16 Q
7th - 9th

20 Q
7th
Explore Line Plots Worksheets by Grades
Explore Other Subject Worksheets for year 7
Explore printable Line Plots worksheets for 7th Year
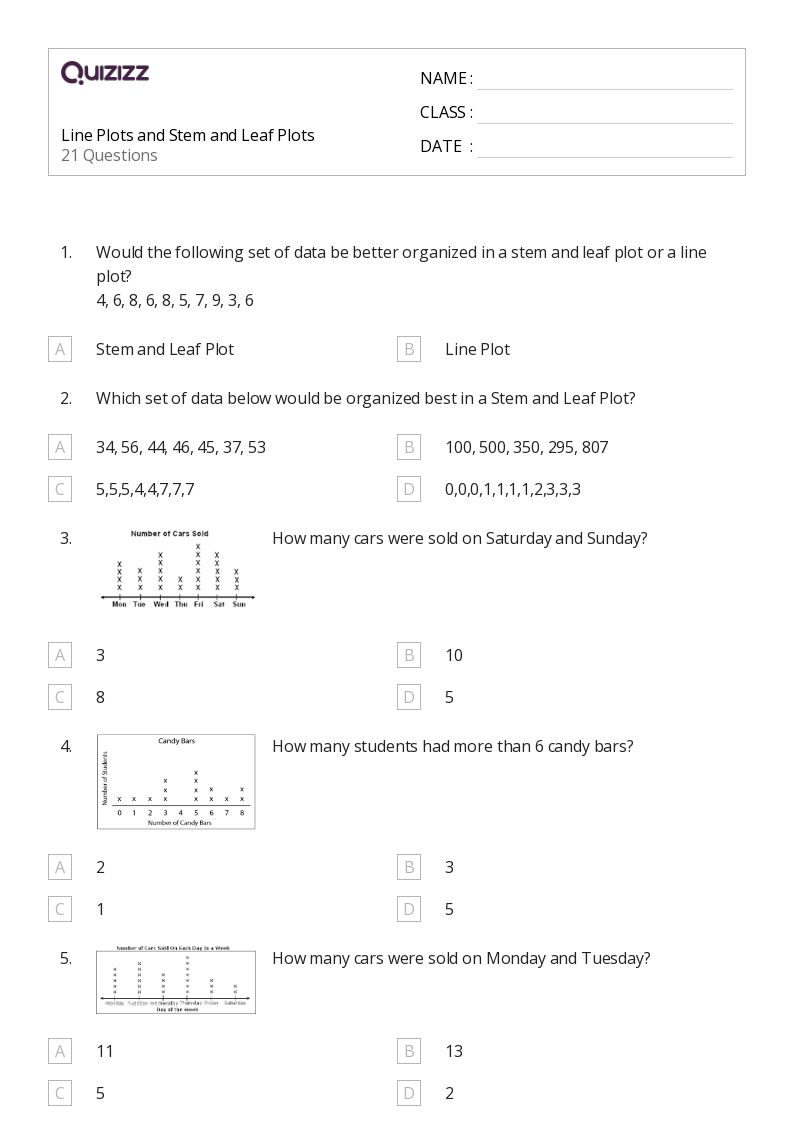
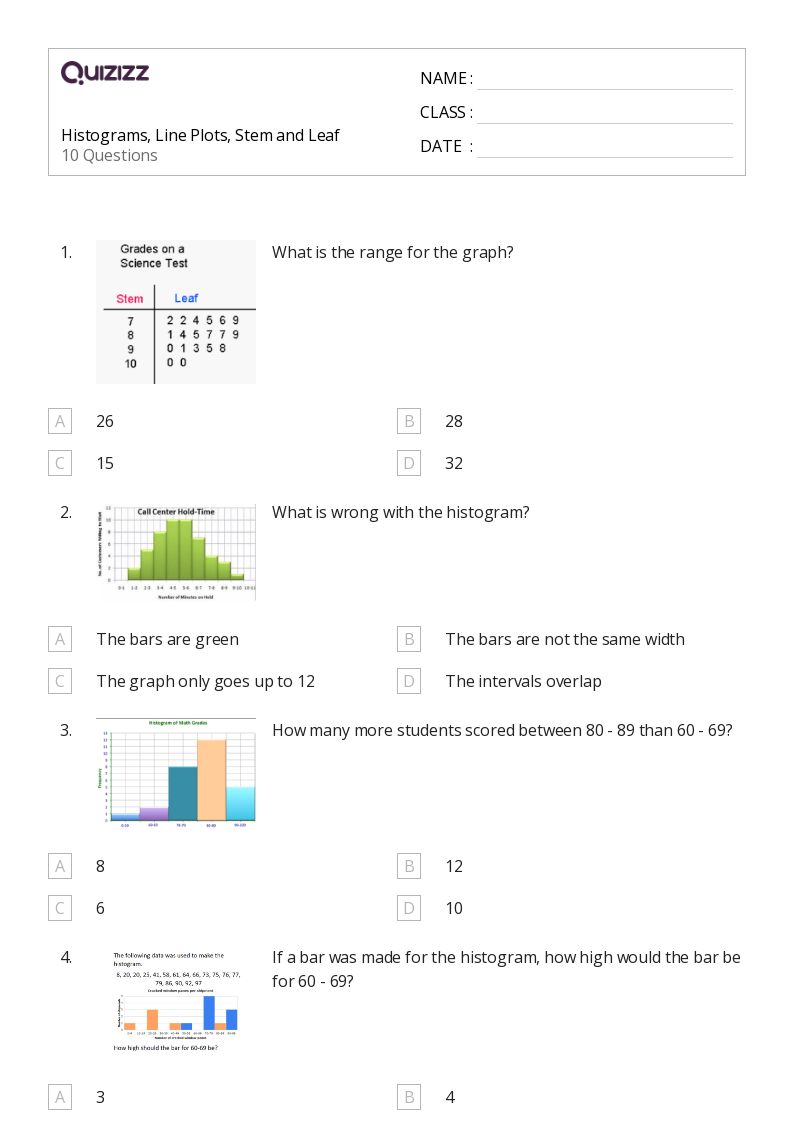
Line Plots worksheets for Year 7 are an essential tool for teachers to help their students master the crucial math skills of data and graphing. These worksheets provide a variety of engaging and challenging exercises that focus on graphing data, interpreting line plots, and analyzing trends. By incorporating these worksheets into their lesson plans, teachers can ensure that their Year 7 students develop a strong foundation in math, which is critical for success in higher-level courses. Furthermore, these Line Plots worksheets for Year 7 are designed to align with the Common Core State Standards, making it easy for teachers to integrate them into their existing curriculum and track student progress.
In addition to Line Plots worksheets for Year 7, teachers can also utilize Quizizz, an interactive platform that offers a wide range of resources to enhance their students' learning experience. Quizizz provides a vast library of quizzes and games that cover various math topics, including data and graphing. Teachers can use these quizzes to supplement their worksheets, assess student understanding, and provide immediate feedback to help students improve their skills. Moreover, Quizizz allows teachers to create their customized quizzes, enabling them to tailor the content to their students' specific needs and learning objectives. By combining Line Plots worksheets for Year 7 with the interactive features of Quizizz, teachers can create a dynamic and engaging learning environment that fosters student success in math.
