25 Q
6th - 8th

13 Q
8th

6 Q
8th - 12th

25 Q
8th

10 Q
6th - 8th

16 Q
8th - 12th

12 Q
6th - 8th

8 Q
6th - 8th

20 Q
6th - 8th

16 Q
8th - 12th

10 Q
8th

6 Q
6th - 8th

16 Q
8th

24 Q
7th - 8th

27 Q
6th - 8th

62 Q
7th - 8th

10 Q
8th

10 Q
8th - 10th

4 Q
7th - 8th

21 Q
8th - 11th

6 Q
8th - 12th

20 Q
6th - 8th

14 Q
8th - 10th
Explore Histograms Worksheets by Grades
Explore Other Subject Worksheets for year 8
Explore printable Histograms worksheets for 8th Year
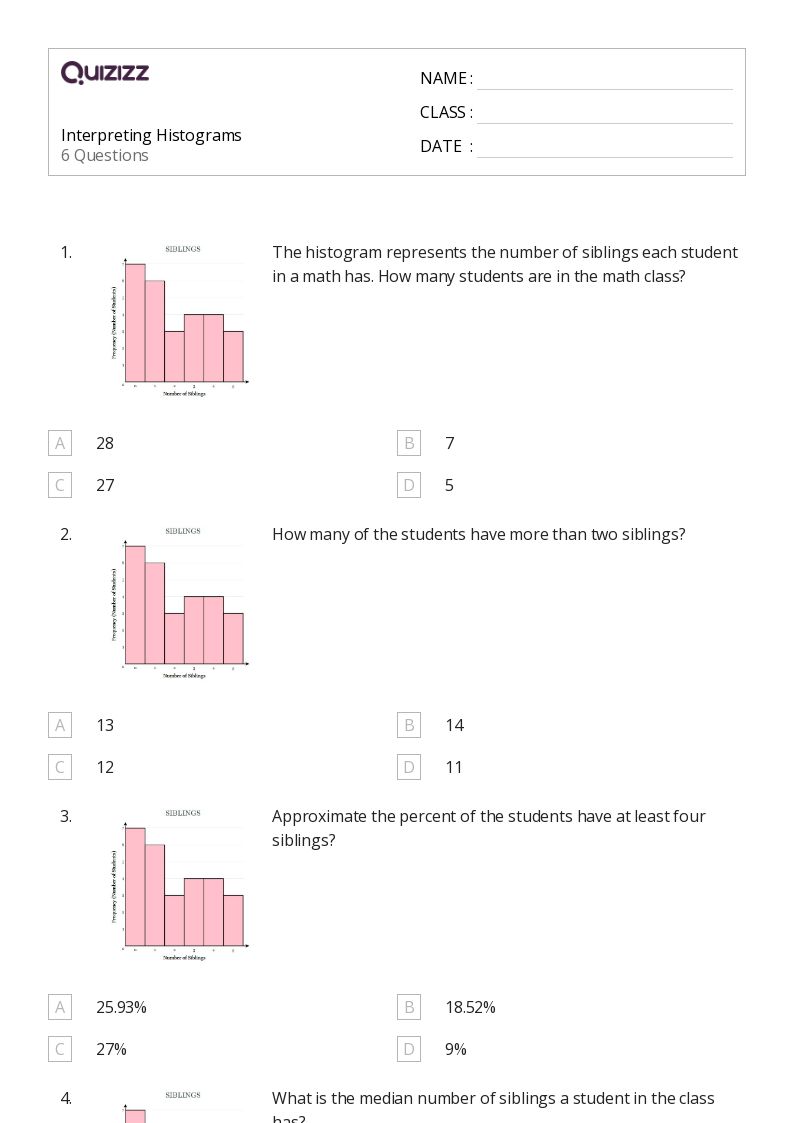
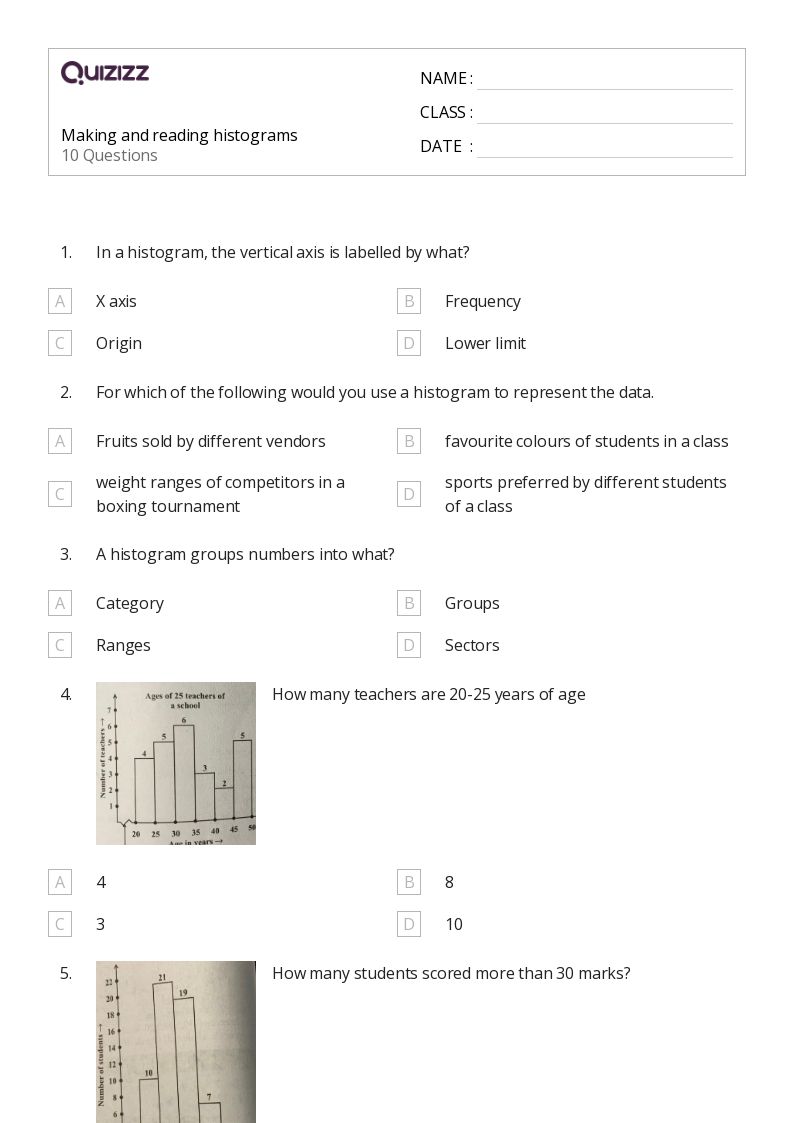
Histograms worksheets for Year 8 are an essential tool for teachers looking to enhance their students' understanding of math, data, and graphing concepts. These worksheets provide a comprehensive and engaging way for students to practice and apply their knowledge of graphing data. By utilizing histograms, students can visually represent and analyze the distribution of data, making it easier for them to grasp complex mathematical concepts. Teachers can incorporate these worksheets into their lesson plans to reinforce the importance of data analysis and interpretation in real-world situations. With a variety of exercises and problems, histograms worksheets for Year 8 ensure that students develop a strong foundation in math, data, and graphing skills.
Quizizz is an excellent platform for teachers to access a wide range of resources, including histograms worksheets for Year 8, to support their students' learning. This interactive platform offers various tools and features that make it easy for teachers to create engaging and personalized quizzes, assignments, and activities. By incorporating Quizizz into their teaching strategies, educators can effectively assess their students' understanding of math, data, and graphing concepts. In addition to histograms worksheets, Quizizz offers a vast library of content covering various topics and grade levels, allowing teachers to find the perfect resources for their students. With Quizizz, educators can ensure that their students are well-equipped with the knowledge and skills needed to excel in Year 8 math, data, and graphing.
