6 Q
3rd

16 Q
3rd

12 Q
3rd - 4th

10 Q
1st - 3rd

10 Q
1st - 3rd

10 Q
1st - 3rd

15 Q
3rd - 5th

55 Q
3rd - 6th

8 Q
1st - 3rd

12 Q
3rd - 5th

26 Q
3rd

21 Q
2nd - 3rd

10 Q
3rd

15 Q
1st - 3rd

10 Q
1st - 3rd

16 Q
1st - 3rd

20 Q
1st - 3rd

8 Q
1st - 3rd

12 Q
1st - 3rd

22 Q
3rd - 6th

20 Q
3rd

10 Q
3rd

6 Q
1st - 3rd

10 Q
3rd
Explore Histograms Worksheets by Grades
Explore Other Subject Worksheets for year 3
Explore printable Histograms worksheets for 3rd Year
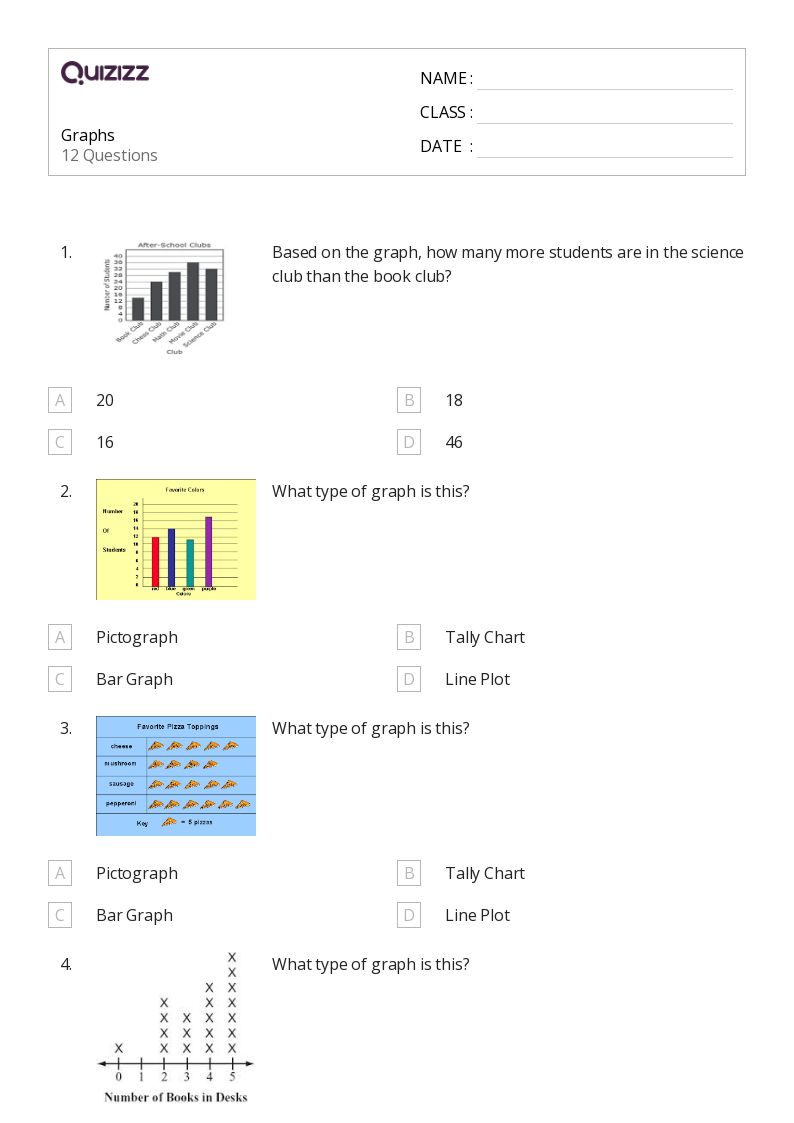
Histograms worksheets for Year 3 are essential tools for teachers to help their students develop a strong foundation in math, specifically in the areas of data and graphing. These worksheets provide a variety of engaging activities and exercises that will enable students to understand the concept of graphing data, as well as how to interpret and analyze histograms. By incorporating these worksheets into their lesson plans, teachers can ensure that their Year 3 students are mastering the necessary skills to succeed in future math courses. With a focus on real-world applications and problem-solving, these histograms worksheets for Year 3 are an invaluable resource for educators looking to enhance their students' understanding of data and graphing concepts.
In addition to histograms worksheets for Year 3, Quizizz offers a wide range of resources and tools that can help teachers create interactive and engaging learning experiences for their students. With Quizizz, educators can access a vast library of quizzes, worksheets, and other learning materials that cover various topics in math, including data and graphing. Teachers can also create their own customized quizzes and worksheets, allowing them to tailor the content to their students' specific needs and learning objectives. By incorporating Quizizz into their teaching strategies, educators can ensure that their Year 3 students are not only mastering the skills necessary to understand histograms and graphing data but also developing a lifelong love for learning and mathematics.
