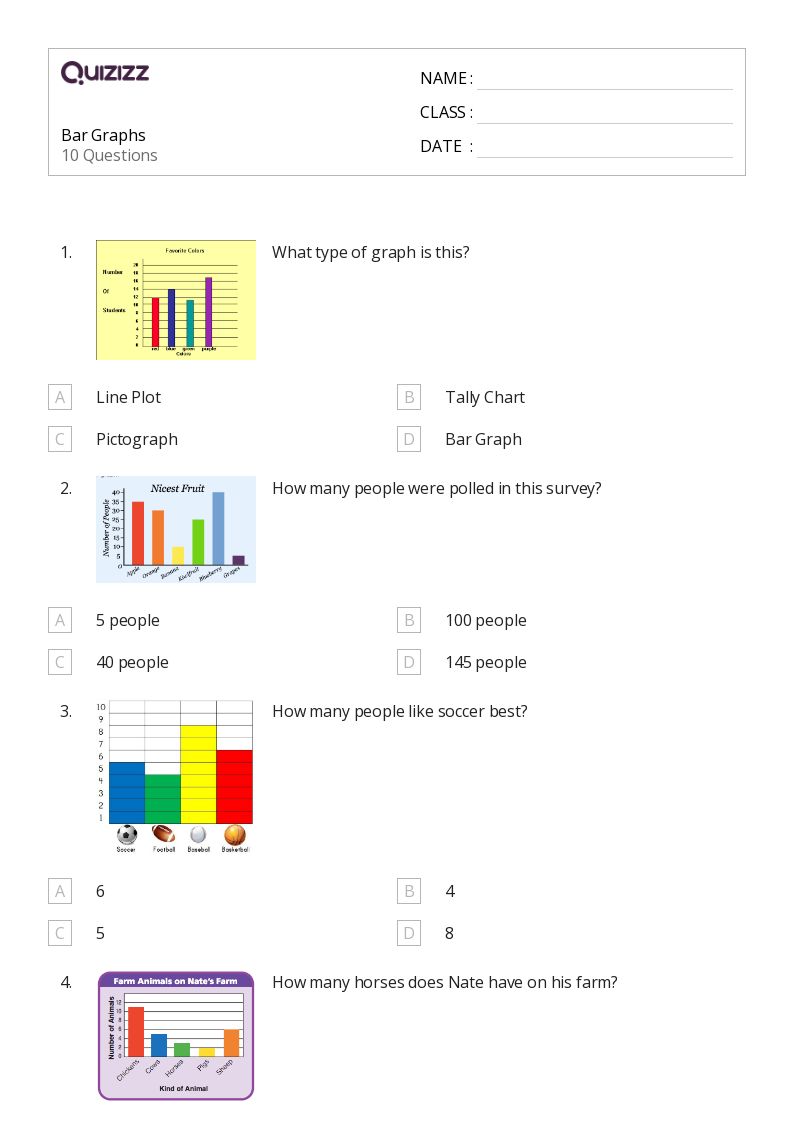
10 Q
2nd - 4th

16 Q
4th

15 Q
4th

10 Q
2nd - 4th

12 Q
3rd - 4th
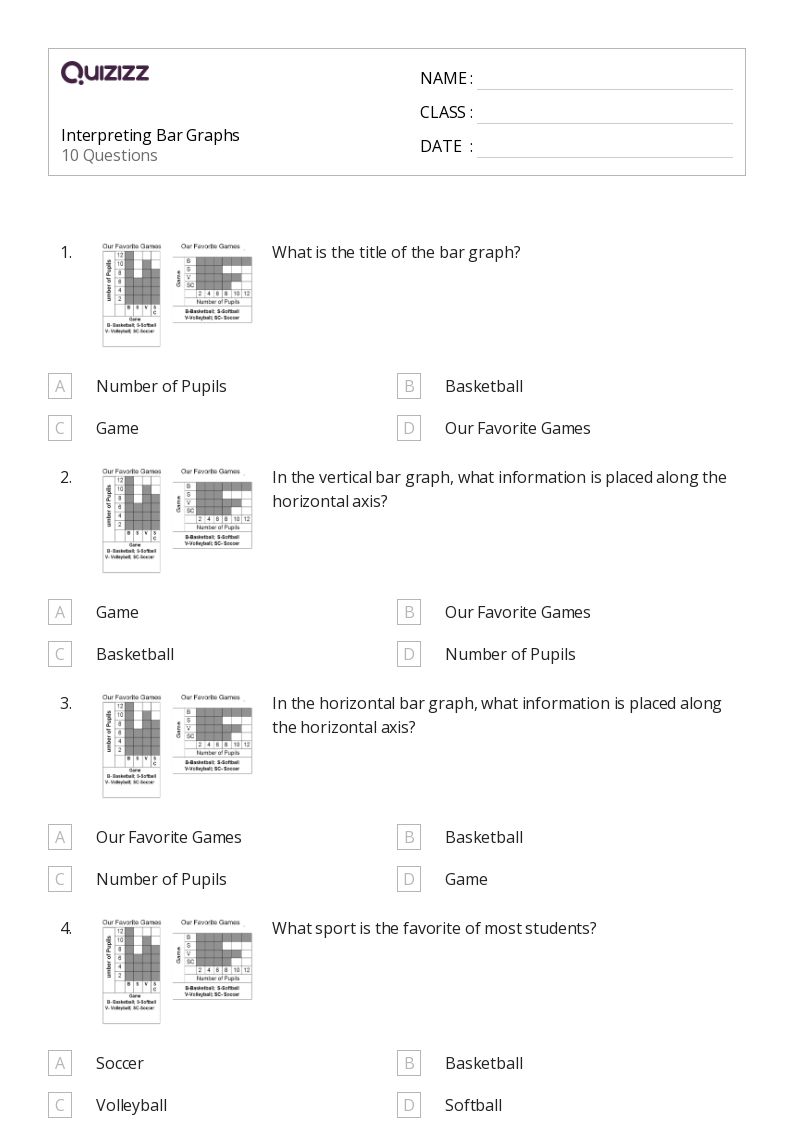
10 Q
4th

15 Q
4th

3 Q
4th

20 Q
4th - 6th
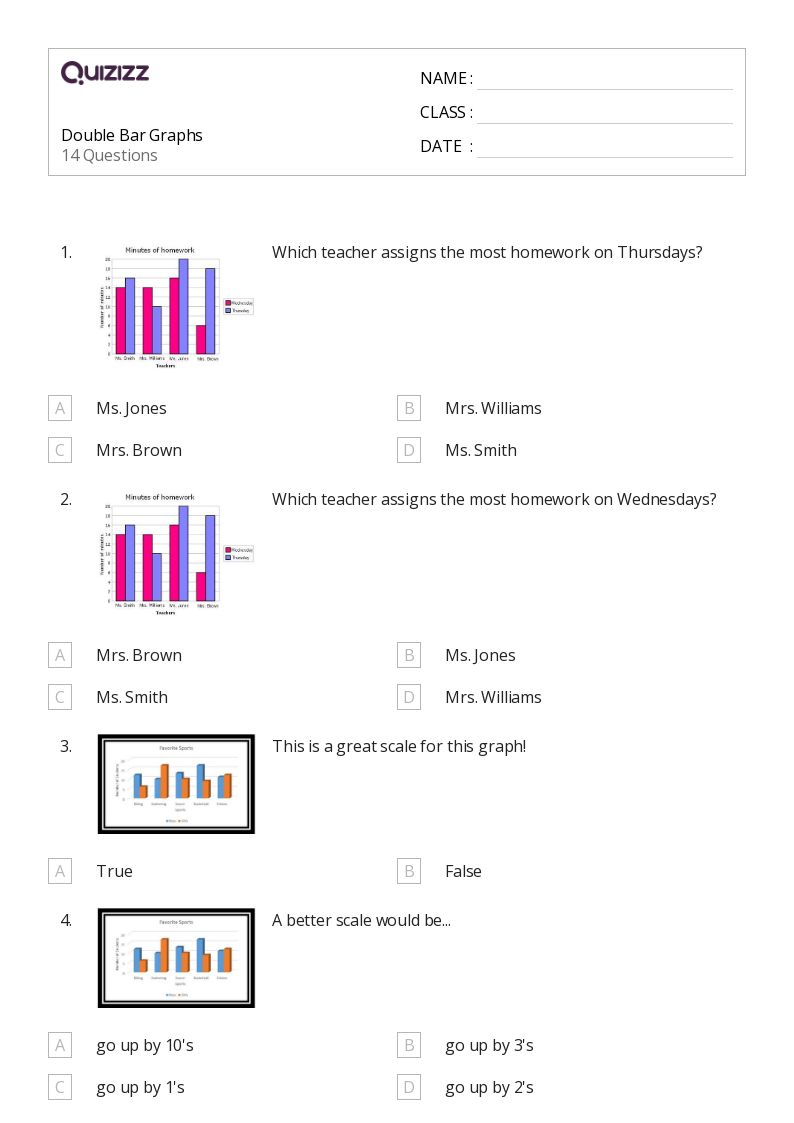
14 Q
4th

10 Q
2nd - 4th
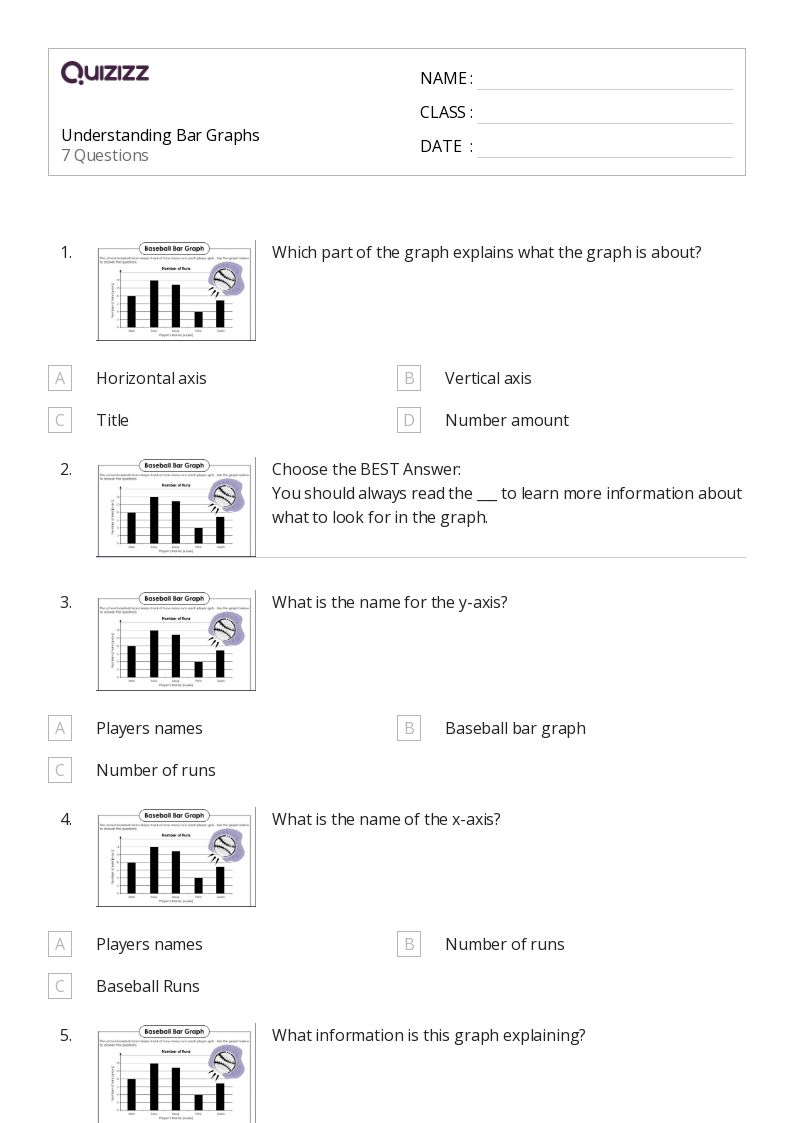
7 Q
4th - 8th

20 Q
3rd - 4th

10 Q
4th - 5th

4 Q
4th

10 Q
4th

12 Q
3rd - 4th
10 Q
4th

25 Q
4th - 5th

13 Q
4th

12 Q
4th - 5th
11 Q
4th

10 Q
4th
Explore Bar Graphs Worksheets by Grades
Explore Other Subject Worksheets for grade 4
Browse resources by Grade
Browse resources by Subject
Explore printable Bar Graphs worksheets for 4th Grade
Bar Graphs worksheets for Grade 4 are an essential tool for teachers to help their students develop a strong foundation in math, data, and graphing concepts. These worksheets provide a variety of engaging and interactive activities that allow students to practice their skills in graphing data, interpreting bar graphs, and understanding the relationship between data sets. By incorporating these worksheets into their lesson plans, teachers can ensure that their Grade 4 students gain a comprehensive understanding of how to analyze and represent data using bar graphs. Furthermore, these worksheets are designed to align with the curriculum standards for Grade 4 math, ensuring that students are well-prepared for future assessments and academic success. Bar Graphs worksheets for Grade 4 are a valuable resource for teachers looking to enhance their students' learning experience in the realm of data and graphing.
Quizizz is an innovative platform that offers a wide range of educational resources, including Bar Graphs worksheets for Grade 4, to support teachers in their efforts to provide engaging and effective learning experiences for their students. In addition to worksheets, Quizizz also offers interactive quizzes, games, and other activities that can be easily integrated into lesson plans to help students develop their skills in math, data, and graphing. By utilizing Quizizz's extensive library of resources, teachers can create a dynamic and interactive learning environment that caters to the diverse needs and learning styles of their Grade 4 students. Moreover, Quizizz's user-friendly interface and customizable features make it an ideal tool for teachers to track student progress, identify areas for improvement, and provide targeted feedback to support their students' growth in the area of graphing data.
