31 Q
7th - 8th

10 Q
6th - 8th

10 Q
8th

13 Q
8th - 10th

8 Q
8th

10 Q
6th - 8th

20 Q
8th - 11th

3 Q
8th

15 Q
8th

12 Q
8th - 9th

6 Q
8th - 10th

7 Q
8th

16 Q
6th - 8th

20 Q
8th

11 Q
8th - 9th

11 Q
6th - 8th

15 Q
6th - 8th

14 Q
8th - 10th

28 Q
8th - 12th

10 Q
5th - 8th

18 Q
7th - 8th

18 Q
8th

20 Q
8th - 10th

47 Q
8th
Explore Interpreting Graphs Worksheets by Grades
Explore Other Subject Worksheets for year 8
Explore printable Interpreting Graphs worksheets for 8th Year
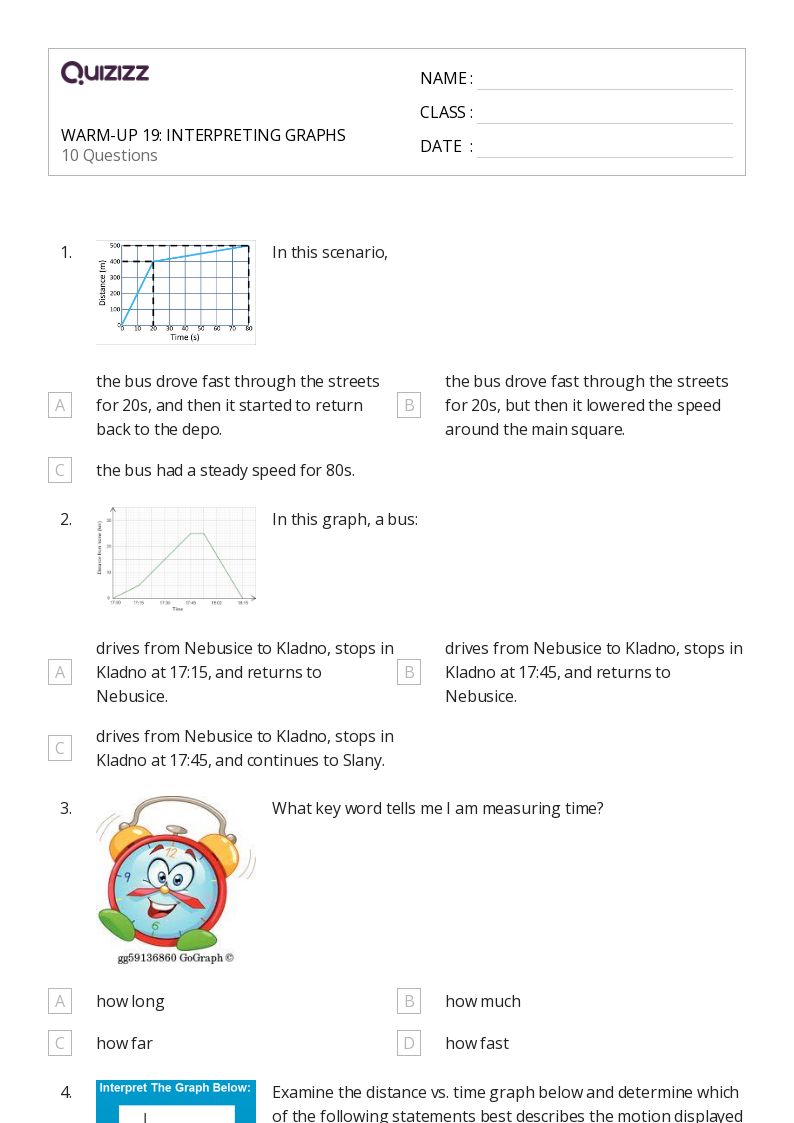
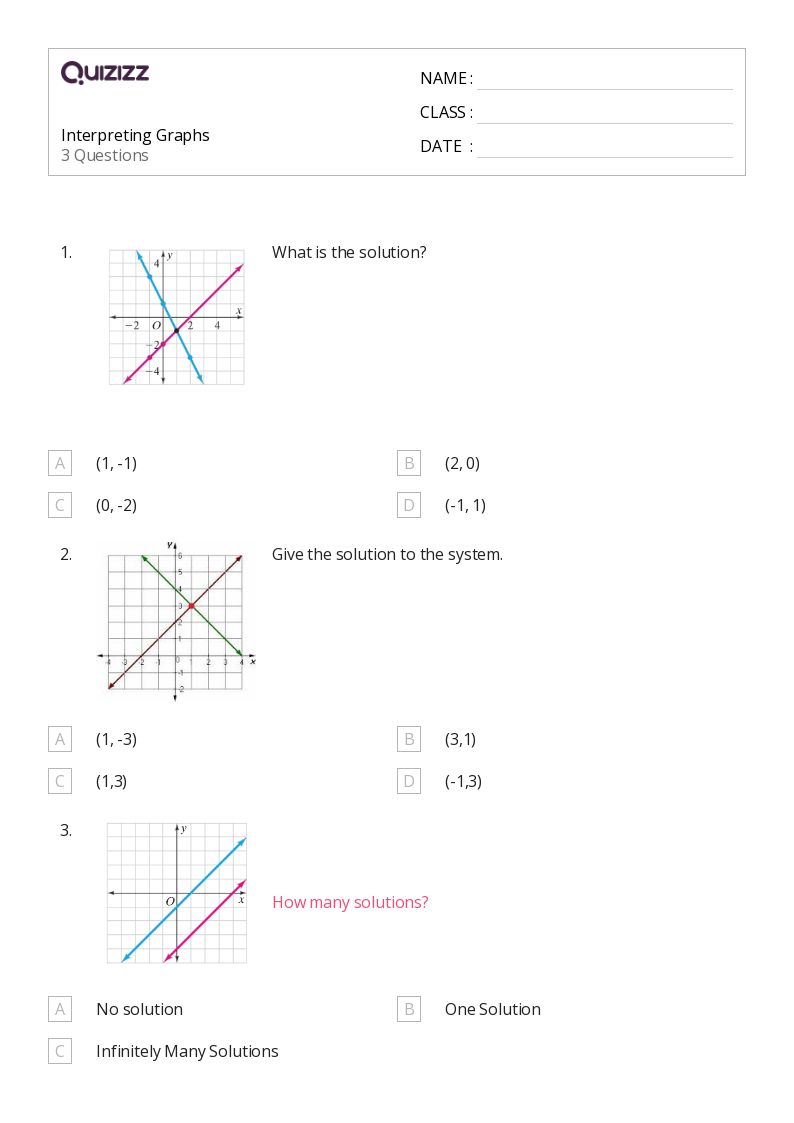
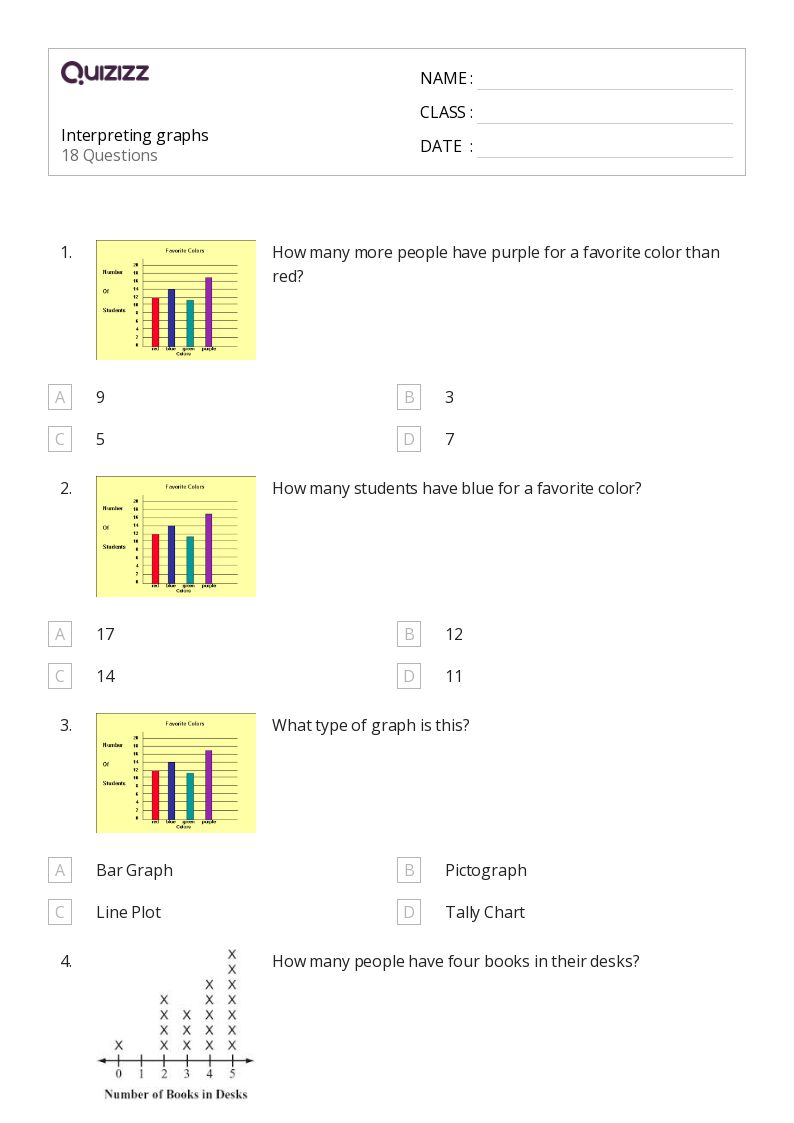
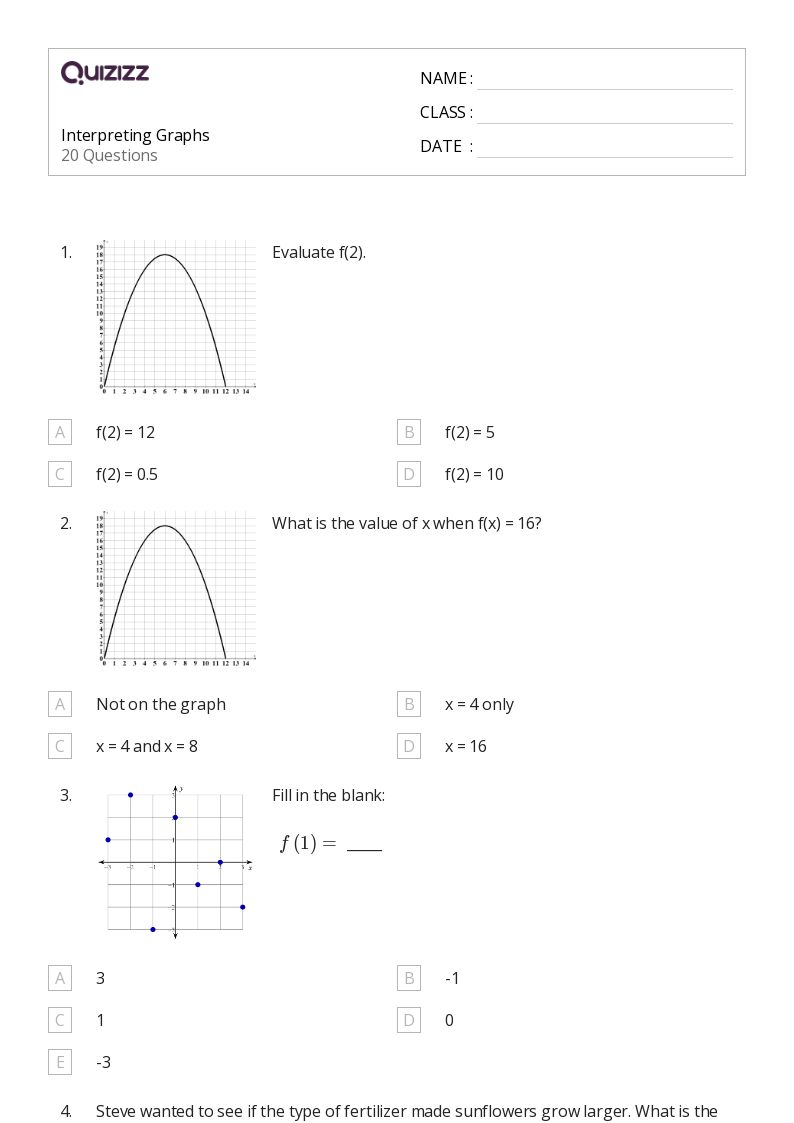
Interpreting Graphs worksheets for Year 8 are an essential tool for teachers looking to enhance their students' understanding of math, data, and graphing concepts. These worksheets provide a variety of engaging activities that help students develop their skills in interpreting and analyzing different types of graphs, such as bar graphs, line graphs, and pie charts. By incorporating these worksheets into their lesson plans, teachers can ensure that their Year 8 students gain a solid foundation in graphing data, which is crucial for success in higher-level math courses. Furthermore, these worksheets can be easily adapted to suit the individual needs and learning styles of each student, making them an invaluable resource for any Year 8 math classroom.
Quizizz is an excellent platform that offers a wide range of resources for teachers, including Interpreting Graphs worksheets for Year 8, as well as other math, data, and graphing materials. This platform allows teachers to create interactive quizzes and games that can be used to supplement their existing lesson plans, making learning more engaging and enjoyable for students. Additionally, Quizizz offers real-time feedback and analytics, allowing teachers to track their students' progress and identify areas where they may need additional support. By incorporating Quizizz into their teaching strategies, educators can provide their Year 8 students with a comprehensive and well-rounded understanding of math, data, and graphing concepts, setting them up for success in their future academic endeavors.
