
Pie charts
Assessment
•

Eric Block
•
Mathematics
•
6th - 9th Grade
•
1K plays
•
Hard
Student preview

12 questions
Show answers
1.
Multiple Choice

32 people went to a ice hockey match. The pie chart shows the colours of their shirts. How many people wore black?
45
1
4
2.
Multiple Choice
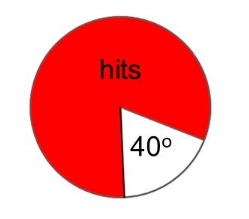
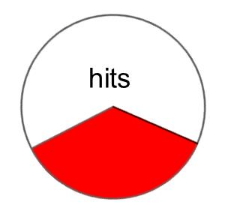
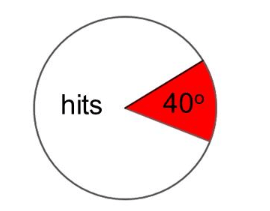
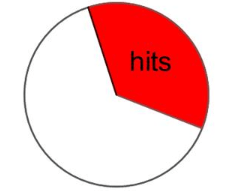
A darts player hits his target 40% of the time. Which pie chart represents his hits and misses?
3.
Multiple Choice
Which of the following can not be found using a pie chart?
range
mode
proportions
mean
4.
Multiple Choice

What is the ratio of tables to chairs?
3:1
3:4
5.
Multiple Choice

The pie chart shows colours of motorbikes in a shop. There are 20 more blue bikes than white. How many bikes are there altogether?
54
160
40
80
Explore all questions with a free account
Find a similar activity
Create activity tailored to your needs using
.svg)

Pie Charts
•
7th - 8th Grade
Pie Charts
•
5th - 6th Grade
Pie charts
•
9th - 11th Grade
PIE CHARTS
•
5th - 6th Grade
pie chart grade 8
•
8th Grade
Y9 U19.2 Online activity
•
7th Grade
PIE CHART
•
7th Grade
Pie chart
•
8th Grade