
STEMBIOCONCEPTS
Assessment
•

Rose Young
•
Biology
•
9th - 10th Grade
•
37 plays
•
Medium
Student preview

5 questions
Show answers
1.
Multiple Choice

The green sea turtle is an endangered species. The graph below shows the estimated number of green sea turtle nests on a beach in Costa Rica between 1970 and 2003. Based on the information in the graph, which of the following is the most likely way humans affected the green sea turtle population during this time?
Humans passed laws preventing the collection of green sea turtles.
Humans collected more green sea turtle eggs for scientists to study.
Humans passed laws protecting animals that eat green sea turtle eggs.
Humans built more hotels on the beach where green sea turtles build nests.
2.
Multiple Choice

All corn plants contain the ZmLA1 gene. Some corn plants contain a certain mutation in the ZmLA1 gene. The graph below shows the amount of ZmLA1 RNA produced in plants with the normal gene and in plants with the mutated gene. Based on the graph, what most likely happens in corn plants as a direct result of the mutated gene?
DNA replication increases
Lipid production decreases
Glucose synthesis increases
Protein production decreases
3.
Multiple Choice
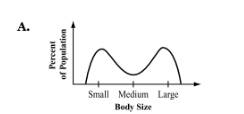
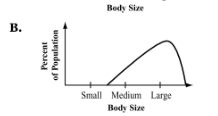
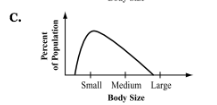
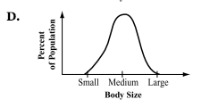
Biologists studied a population of lizards. They found that small lizards had trouble defending their territories and that large lizards were more likely than small of medium lizards to be preyed upon by owls. Which of the following graphs represents the most likely distrubution for body size in this lizard population?
4.
Multiple Choice

The table below shows taxonomic information for the gray wolf and four other species. Based on this information, which of the following lists the species in order from most closely related to the gray wolf?
1, 2, 3, 4
1, 2, 4, 3
2, 1, 3, 4
2, 1, 4, 3
5.
Multiple Choice

Scientists use satellite data to produce images such as the one below, showing the density of plants across Earth's different land areas. Scientists study these images to determine how plant density changes during a year. Which of the following best explains why scientists can predict carbon dioxide concentrations from plant density data?
Plants add carbon dioxide to the atmosphere during germination.
Plants add carbon dioxide to the atmosphere during transpiration.
Plants remove carbon dioxide from the atmosphere during photosynthesis.
Plants remove carbon dioxide from the atmosphere during cellular respiration.
Explore all questions with a free account
Find a similar activity
Create activity tailored to your needs using
.svg)

Biology Quiz
•
9th Grade
Photosynthesis and Cellular Respiration Quiz
•
9th Grade
Photosynthesis
•
9th - 12th Grade
PHOTO & CARBON CYCLE
•
1st - 9th Grade
Gr5,UUnit 1,Concept1,lant needs
•
1st Grade - University
Cellular Processes Vocab #1
•
9th Grade
Photosynthesis
•
3rd - 10th Grade
Photosynthesis
•
9th - 12th Grade