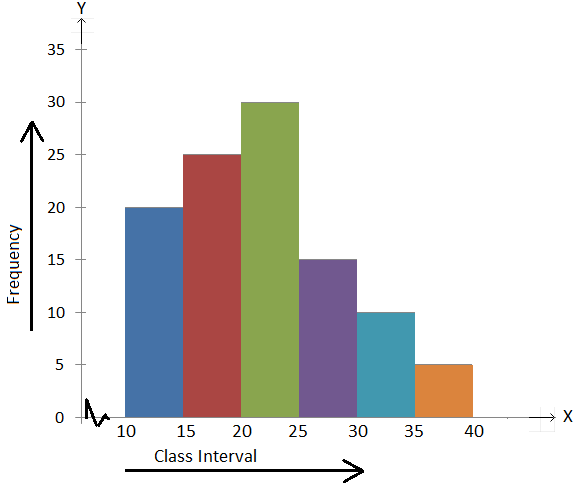
Histogram
A histogram is a frequency distribution graph that shows a bar chart based visual representation of the frequency of a variable on the x-axis along the y-axis

Explore our Quiz Library


19 Slides
Explore other topics
Explore other chapters
Explore the Subjects
Other topics to explore
CBSE | Mathematics | 9th Grade | Coordinate Geometry - Quizizz
CBSE | Mathematics | 9th Grade | Number Systems - Quizizz
CBSE | Mathematics | 9th Grade | Polynomials - Quizizz
CBSE | Mathematics | 9th Grade | Constructions - Quizizz
CBSE | Mathematics | 9th Grade | Areas of Parallelograms and Triangles - Quizizz
Explore our powerful tools
Live Engagement
Presentations, quizzes, and polls
Asynchronous Learning
Asynchronous concept checks and study tools
Insights and Reporting
Meaningful feedback for everyone