Line Graphs - Year 6/Grade 5
Assessment
•
Tahseen Ayaan
•
Mathematics
•
5th Grade
•
5 plays
•
Medium
Improve your activity
Higher order questions
Match
•
Reorder
•
Categorization
.svg)
actions
Add similar questions
Add answer explanations
Translate quiz
Tag questions with standards
More options
5 questions
Show answers
1.
Multiple Choice

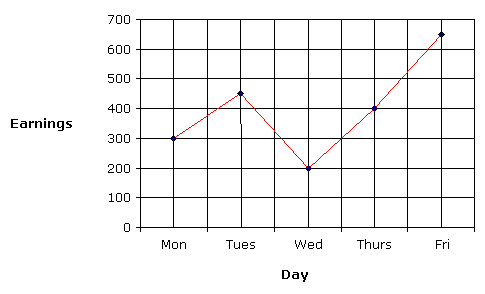
How many earrings were in Tuesday?
450
600
420
650
2.
Multiple Choice

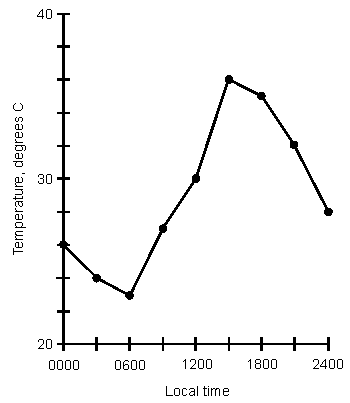
What was the time when the temperature was highest?
12:00
06:00
15:00
24:00
Answer explanation
The Answer is in the Line graph x axis
3.
Multiple Choice
Where are line graphs mostly used?
Offices
Fire Departments
Game Headquarters
Commentating
4.
Multiple Choice

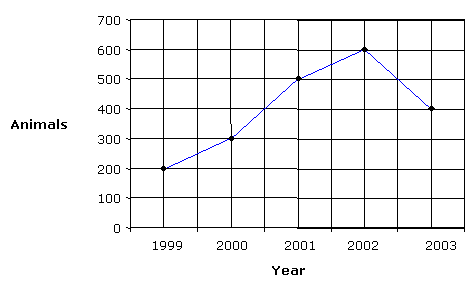
In 2002, how many animals were there?
600
200
500
100
5.
Multiple Choice

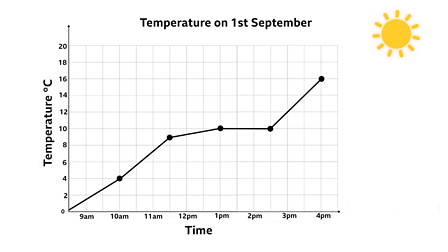
What was the temperature at 4pm at noon?
16 degrees
2 degrees
8 degrees
12 degrees

Explore this activity with a free account
Find a similar activity
Create activity tailored to your needs using
.svg)

Liquid Volume (metric)
•
KG - 2nd Grade

Number Pairs
•
1st Grade

Months Of Year
•
1st Grade

Subtraction
•
KG - 1st Grade

Ordinal Numbers
•
KG

Decompose
•
KG

Doubling and Halving
•
KG

Writing Equations
•
9th Grade