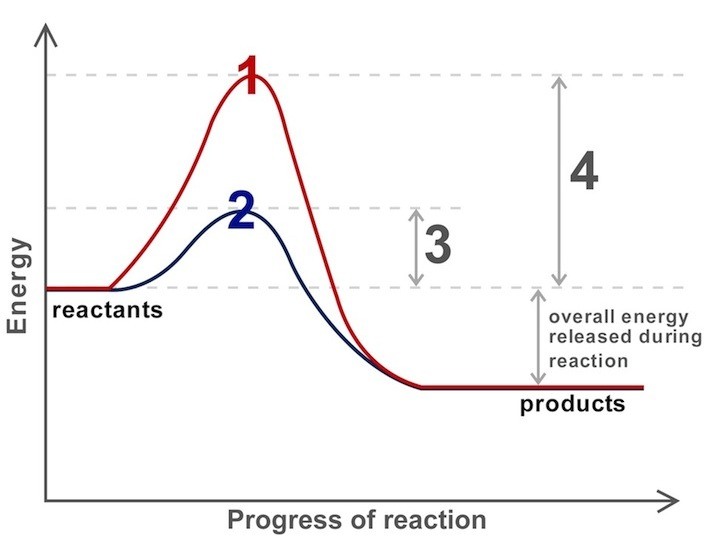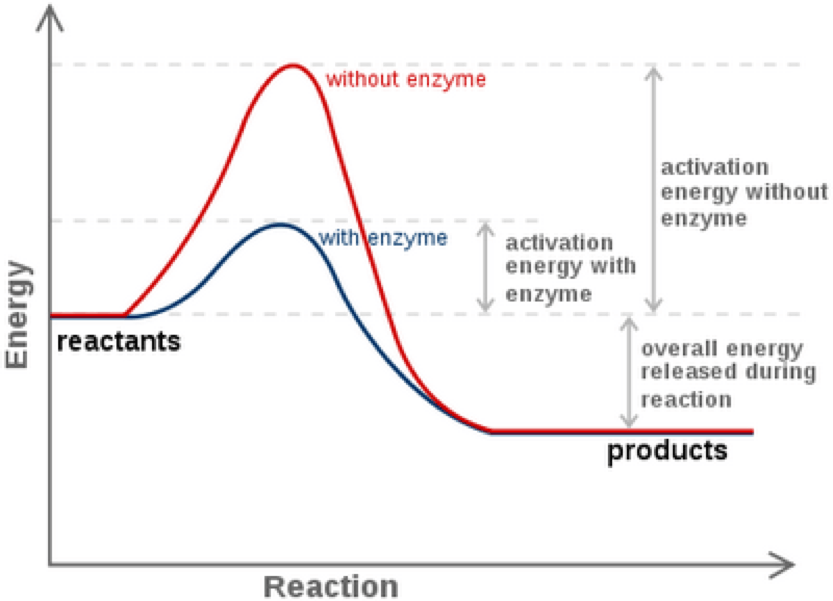
enzyme graphs
Assessment
•
Ayesha Denny
•
Biology
•
9th Grade
•
166 plays
•
Medium
Improve your activity
Higher order questions
Match
•
Reorder
•
Categorization
.svg)
actions
Add similar questions
Add answer explanations
Translate quiz
Tag questions with standards
More options
14 questions
Show answers
1.
Multiple Choice
Most enzymes are composed of .....
Lipids
Carbohydrates
Proteins
Nucleic Acids
2.
Multiple Choice
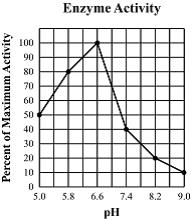
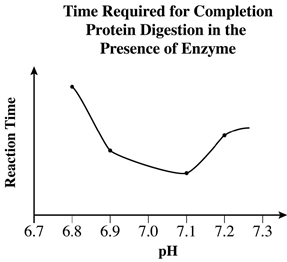
The optimum pH of the enzyme is 6.6.
The optimum pH of the enzyme is 5.8
The enzyme’s activity increases as pH increases 5.0 to 9.0
The enzyme’s activity is greater around pH of 8.0 .
3.
Multiple Choice
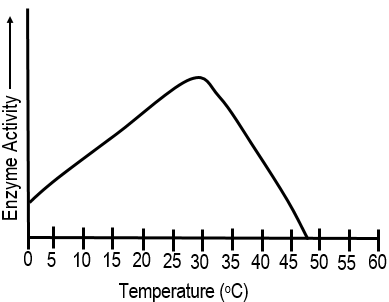
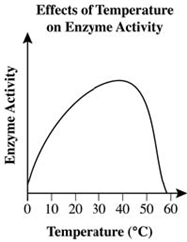
15oC
40oC
30oC
35oC
4.
Multiple Choice
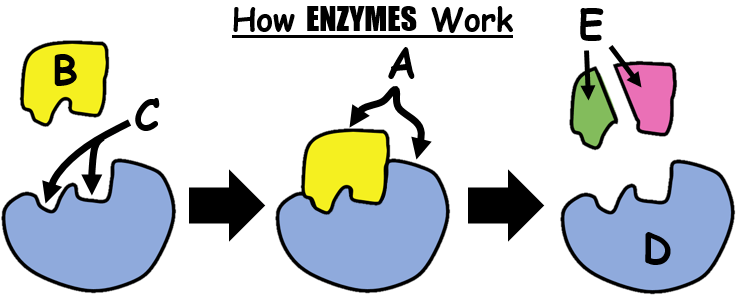
active site
enzyme
substrate
products
5.
Multiple Choice
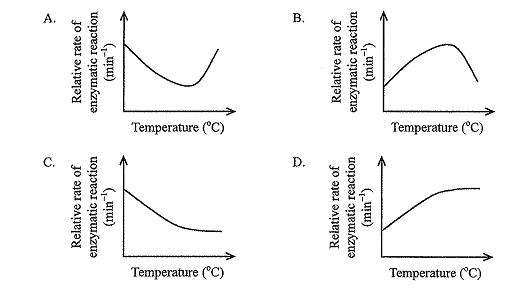
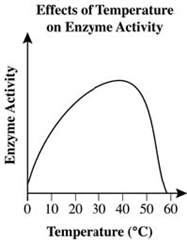
In an experiment to investigate the effect of temperature on the activity of a digestive enzyme X, the time taken for the digestion of a fixed amount of substrate by this enzyme was recorded. Which of the following graphs shows the most likely results of the experiment?
A
B
C
D
6.
Multiple Choice
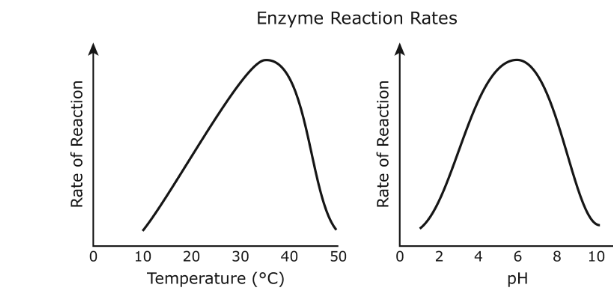
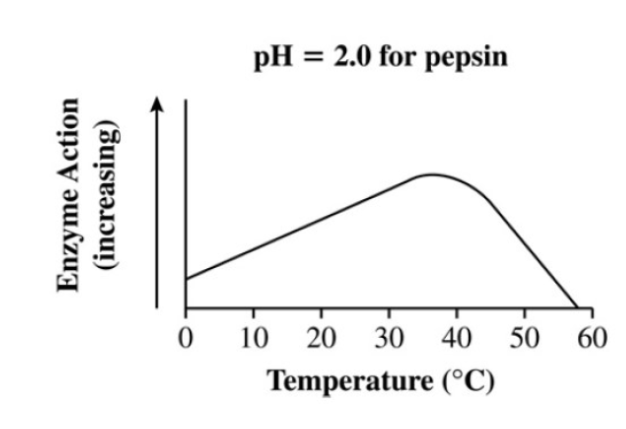
The graphs show the reaction rate for an enzyme across a range of temperatures and pH.
Based on these data, this enzyme functions best as what temperature and pH?
Temperature of 27oC and a pH of 4
Temperature of 37oC and a pH of 6
Temperature of 40oC and a pH of 8
Temperature of 50oC and a pH of 10

Explore this activity with a free account
Find a similar activity
Create activity tailored to your needs using
.svg)

Enzymes
•
9th - 12th Grade

Enzymes
•
9th Grade

Enzymes
•
9th - 12th Grade

Enzymes
•
8th - 10th Grade

Enzymes
•
9th - 10th Grade

Enzymes
•
9th - 10th Grade

Enzymes
•
9th Grade

Enzyme Quiz
•
9th Grade
