Math 6 Q4 A2
Assessment
•
Roldan Roperos
•
Mathematics
•
6th Grade
•
3 plays
•
Hard
Improve your activity
Higher order questions
Match
•
Reorder
•
Categorization
.svg)
actions
Add similar questions
Add answer explanations
Translate quiz
Tag questions with standards
More options
35 questions
Show answers
1.
Multiple Choice
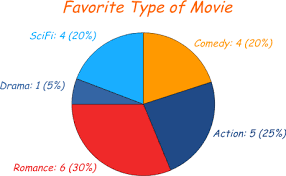
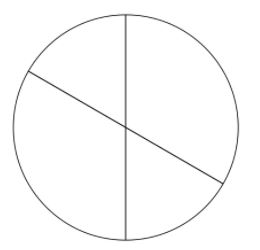
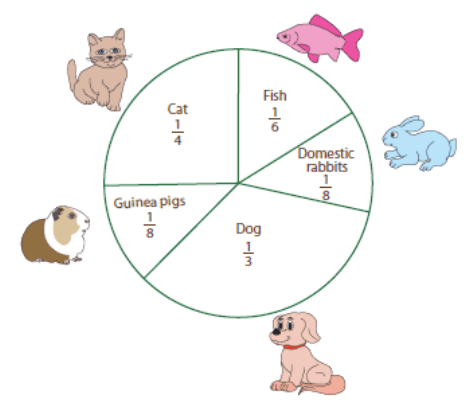
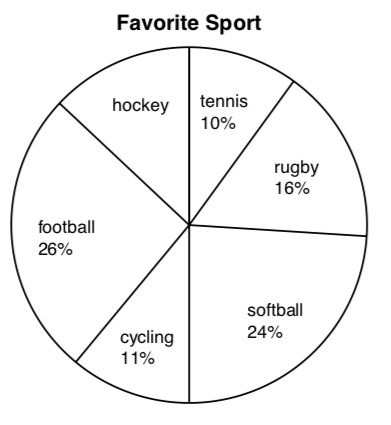
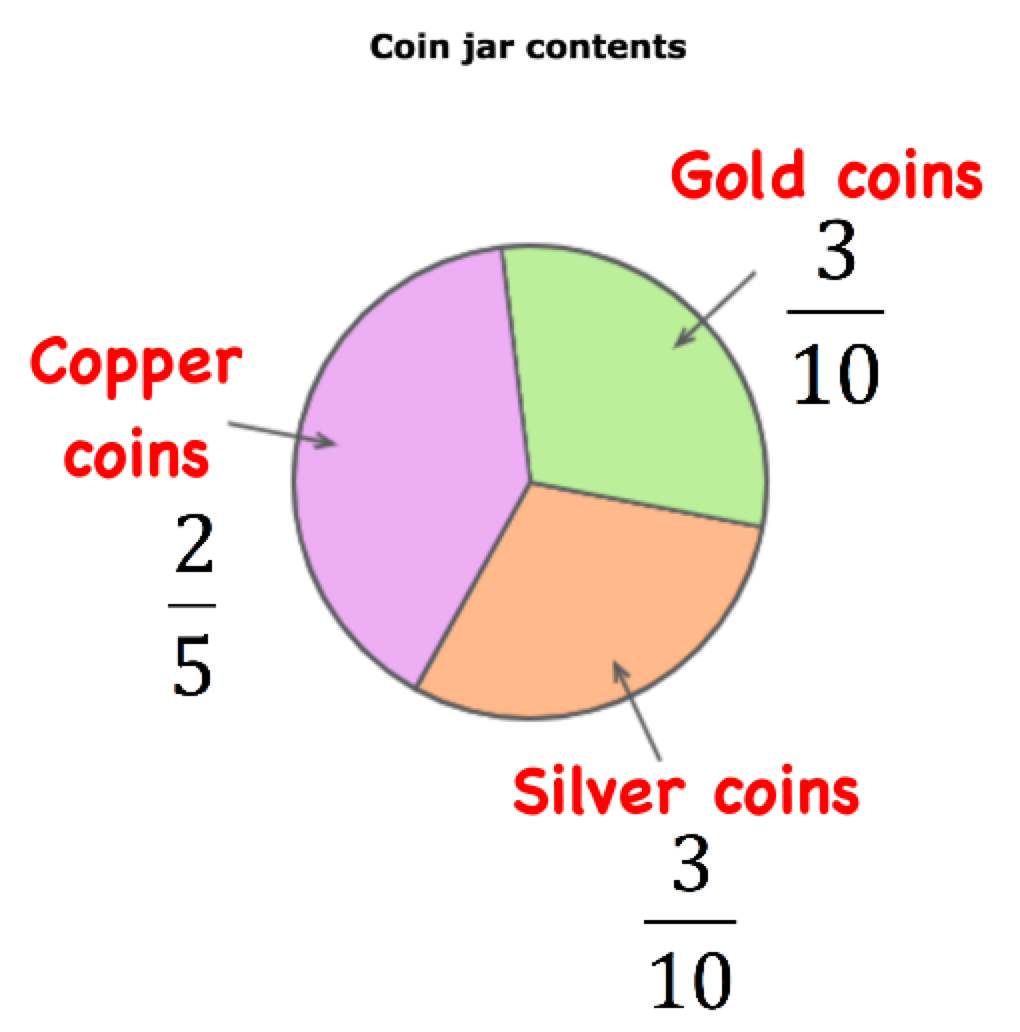
What type of graph is shown?
pictograph
stem and leaf
pie chart
histogram
2.
Multiple Choice
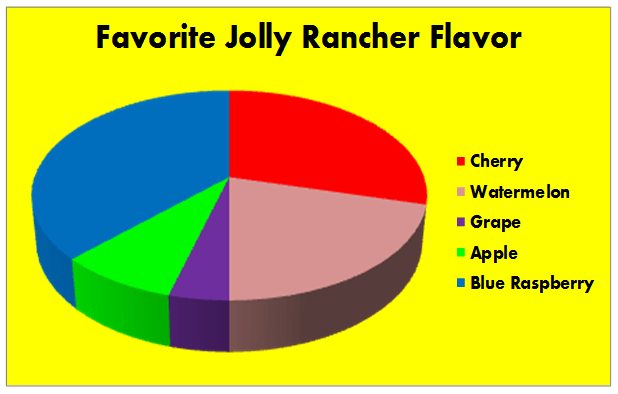
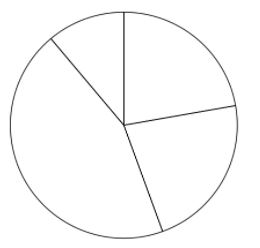
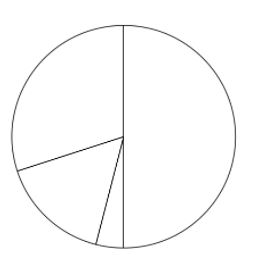
Blue Rasberry
Watermelon
Grape
Apple
3.
Multiple Choice
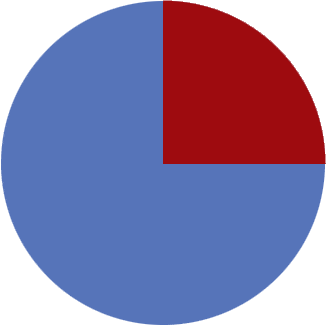
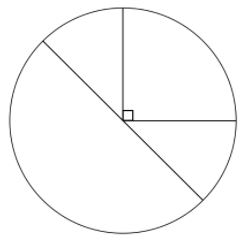
What percent of the graph is red?
50
25
75
360
4.
Multiple Choice
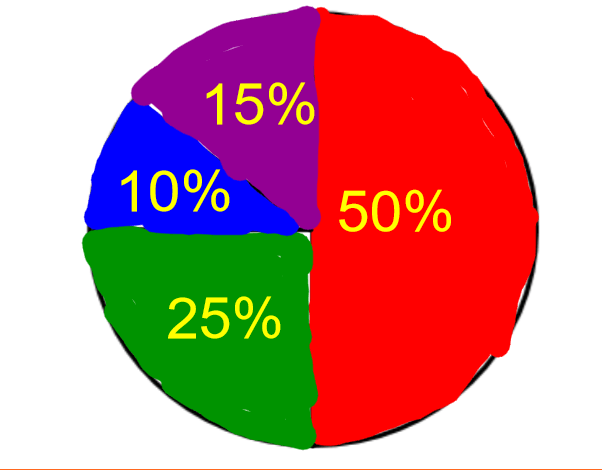
60 people were surveyed. How many liked red?
25
10
30
15
5.
Multiple Choice
What is a Pie Graph?
A graph that uses pictures of pie to display data.
A graph that uses bars to display data
A graph that is shaped like a circle to display data
6.
Multiple Choice
25% of a circle is equal to:
one-fifth
a quarter
a half
two fifth

Explore this activity with a free account
Find a similar activity
Create activity tailored to your needs using
.svg)

Factoring
•
8th Grade

Introduction to Statistics
•
7th - 10th Grade

Statistics and Probability
•
11th Grade

Sampling Techniques
•
11th Grade

Two Step Word Problems
•
2nd Grade

Random Sampling
•
11th Grade

Factors
•
4th Grade

Probability
•
3rd Grade

