Frequency Diagrams and Pie Charts 2
Assessment
•
Axel TOKO
•
Mathematics
•
8th Grade
•
Hard
Student preview

18 questions
Show answers
1.
Multiple Choice
30 sec
1 pt

A PIE Chart is created using
Cherries
Apples
Data
Cars
2.
Multiple Choice
30 sec
1 pt

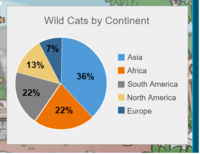
Which Continent is home to 36% of the wild cats?
Asia
Africa
North America
South America
3.
Multiple Choice
30 sec
1 pt

Which Continent is home to 13% of wild cats?
Asia
Africa
North America
South America
4.
Multiple Choice
1 min
1 pt
What percentage does a whole circle graph represent?
360%
90%
50%
100%
5.
Multiple Choice
2 mins
1 pt

According to this graph, what is the most popular flavor of Jolly Rancher?
Cherry
Grape
Blue Raspberry
Watermelon
6.
Multiple Choice
1 min
1 pt

Tina spends _____ of her day at work.
33%
29%
9%
6%

Explore this activity with a free account
Find a similar activity
Create activity tailored to your needs using
.svg)

18 questions
Frequency Diagram and Pie Chart
•

20 questions
Pie Charts
•

13 questions
pie charts
•

18 questions
pie charts
•

13 questions
Pie Charts, Frequency Tables, Bar Graphs
•

20 questions
Pie Charts
•

20 questions
Pie Charts
•

20 questions
Frequency Diagrams
•


