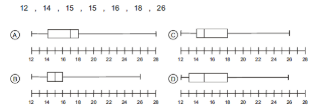
Dot Plot, Histogram, Box Plot
Assessment
•
Marissa Cossaro
•
Mathematics
•
9th Grade
•
559 plays
•
Medium
Improve your activity
Higher order questions
Match
•
Reorder
•
Categorization
.svg)
actions
Add similar questions
Add answer explanations
Translate quiz
Tag questions with standards
More options
20 questions
Show answers
1.
Multiple Choice
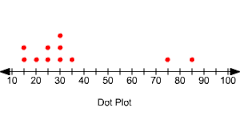
What is the range (maximum-minimum) of the data shown?
85
90
80
70
2.
Multiple Choice
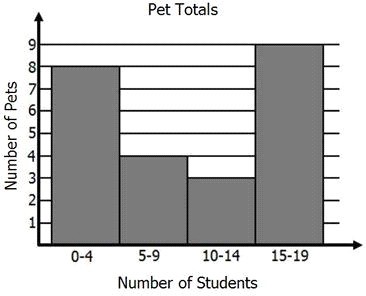
Which interval shows the greatest number of pets?
15-19
0-4
5-9
10-14
3.
Multiple Choice
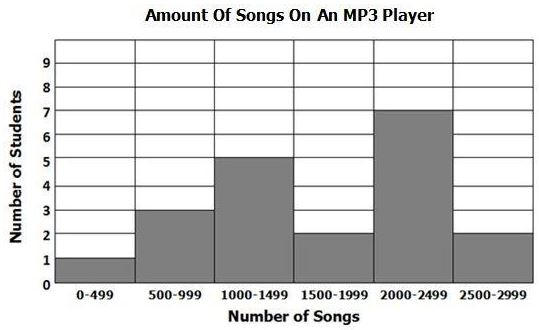
How many students have more than 1,000 songs on their MP3 player?
5
16
10
4
4.
Multiple Choice
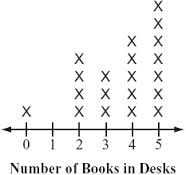
2
3
4
5
5.
Multiple Choice
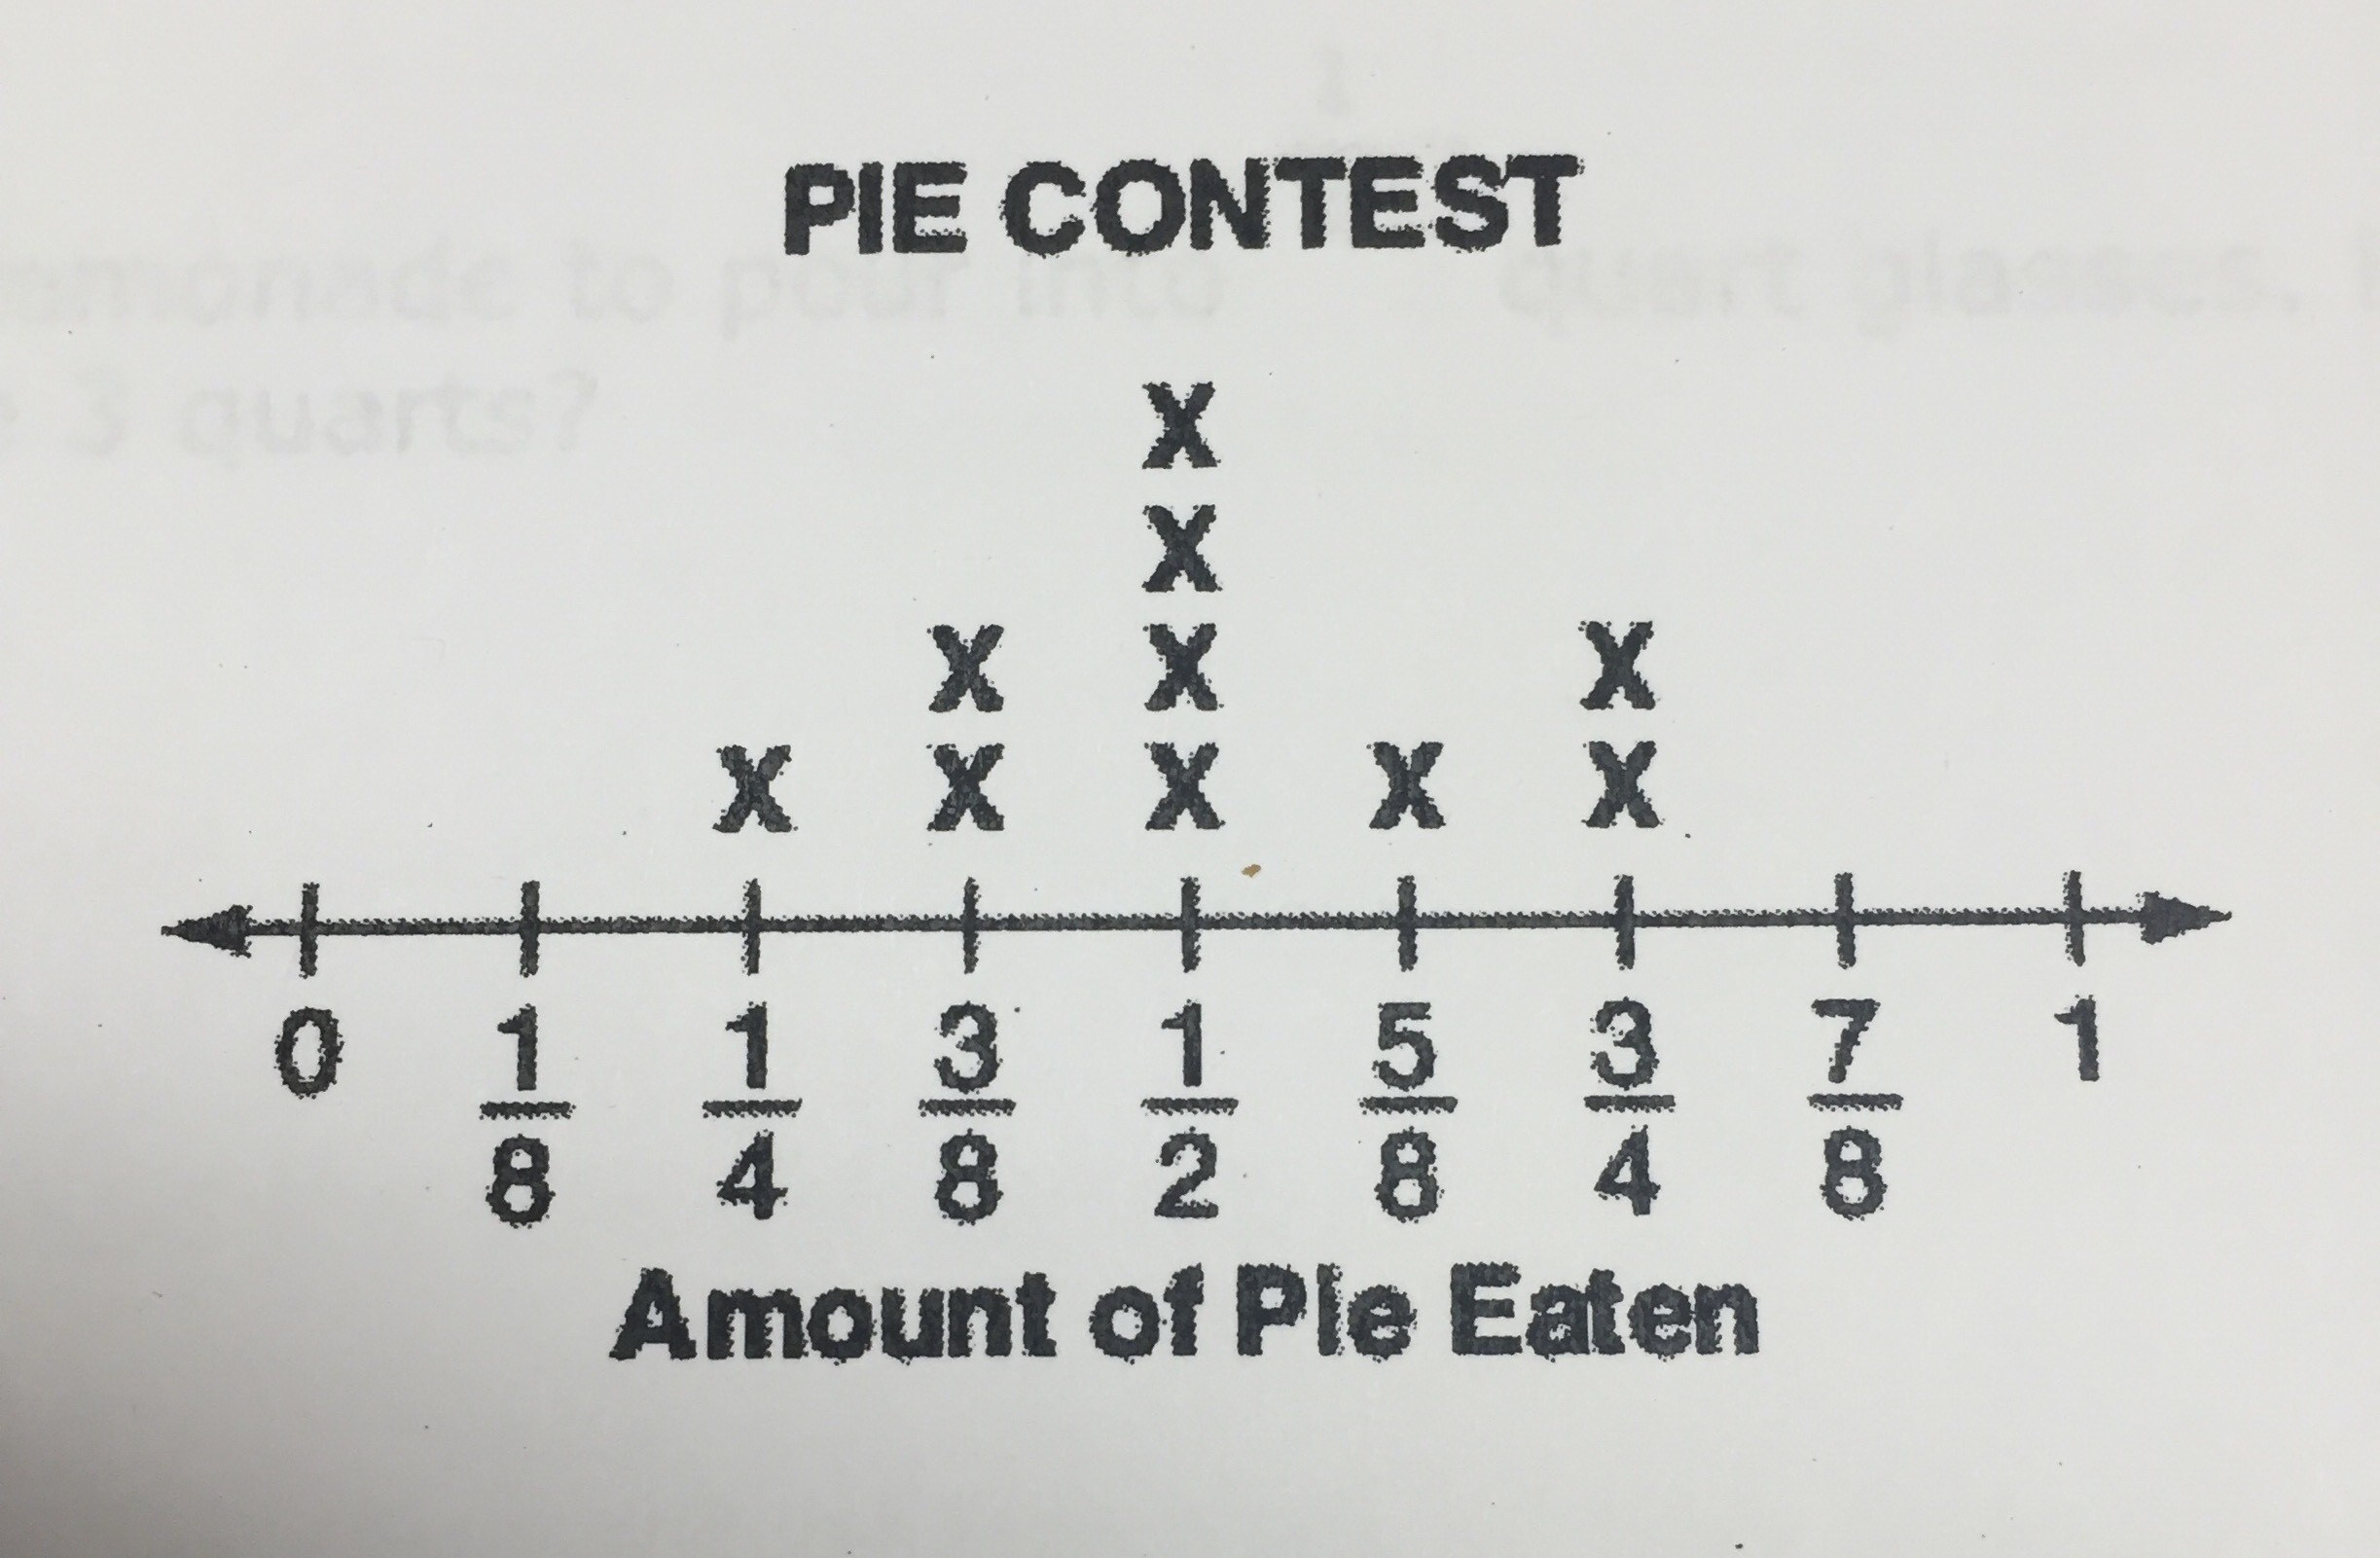
1/2
5/8
1
3/8
6.
Multiple Choice

Which box and whisker plot has the highest median?
First plot
Second plot

Explore this activity with a free account
Find a similar activity
Create activity tailored to your needs using
.svg)

Box and Whisker Plots
•
6th - 8th Grade

Box and Whisker Plots
•
9th - 12th Grade

Box Plots
•
9th - 10th Grade

Histograms
•
6th Grade

Mean, Median, Mode, Box and Whisker
•
9th - 12th Grade

Levels of Measurements
•
11th Grade - University

Dot Plots
•
4th Grade

Analyzing Histograms
•
9th Grade


