Creating stem and leaf diagrams - Grade 8 practice
Assessment
•
Geoffrey Lufanana
•
Mathematics
•
8th - 9th Grade
•
30 plays
•
Medium
Improve your activity
Higher order questions
Match
•
Reorder
•
Categorization
.svg)
actions
Add similar questions
Add answer explanations
Translate quiz
Tag questions with standards
More options
20 questions
Show answers
1.
Multiple Choice
List, from least to greatest, the stems of a stem-and-leaf plot representing the following data set:
2, 29, 65, 31, and 93.
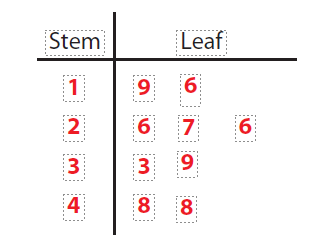
Hint; in this question, imagine you are drawing a stem and leaf diagram form the data, what would the numbers in the stem be in ascending order.
1, 2, 3, 5, 9
0, 2, 3, 6, 9
0, 1, 2, 3, 9
0, 2, 3, 6, 8
1, 2, 3, 6, 9
2.
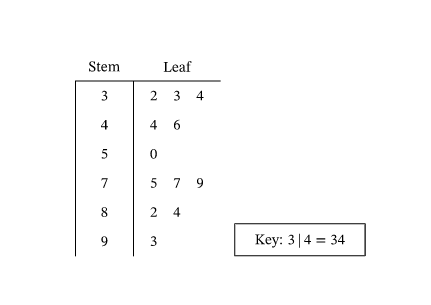
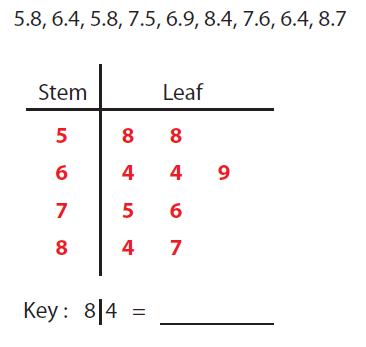
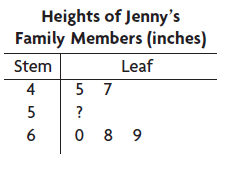
Fill in the Blank
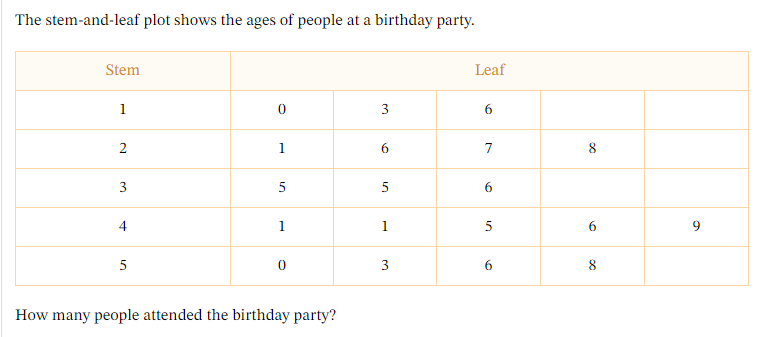
Write the number only.
3.
Multiple Choice

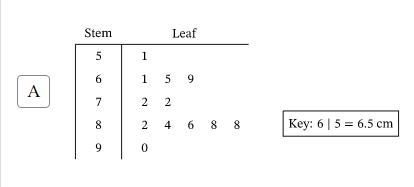
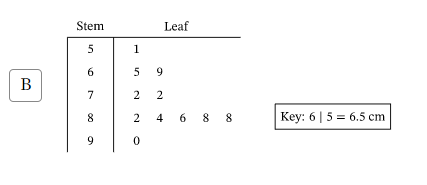
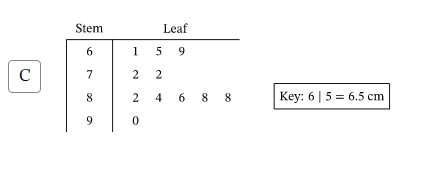
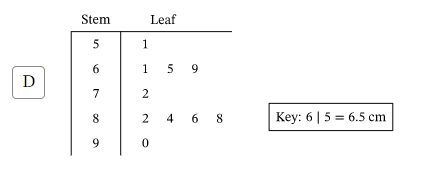
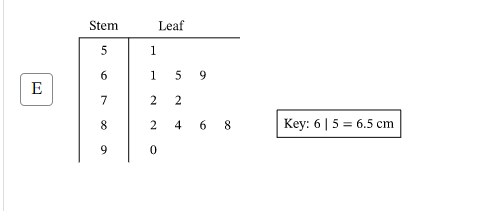
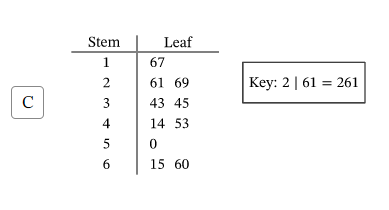
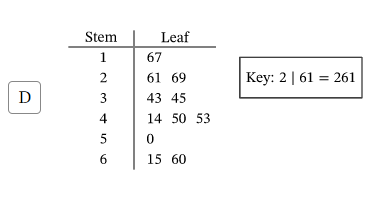
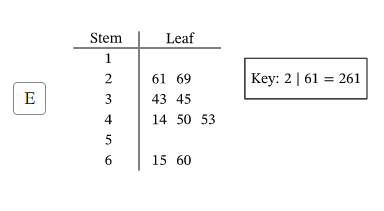
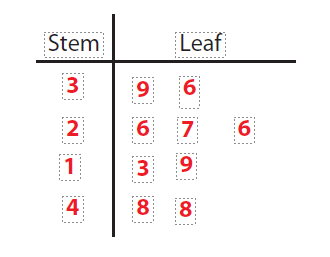
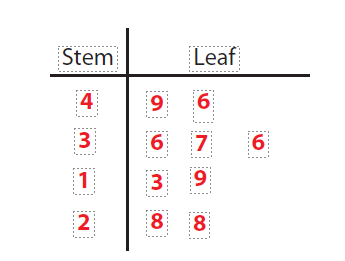
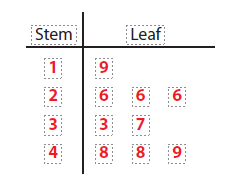
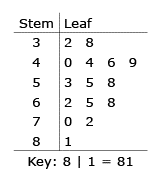
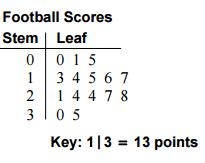
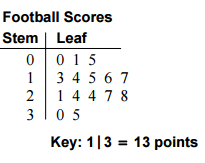
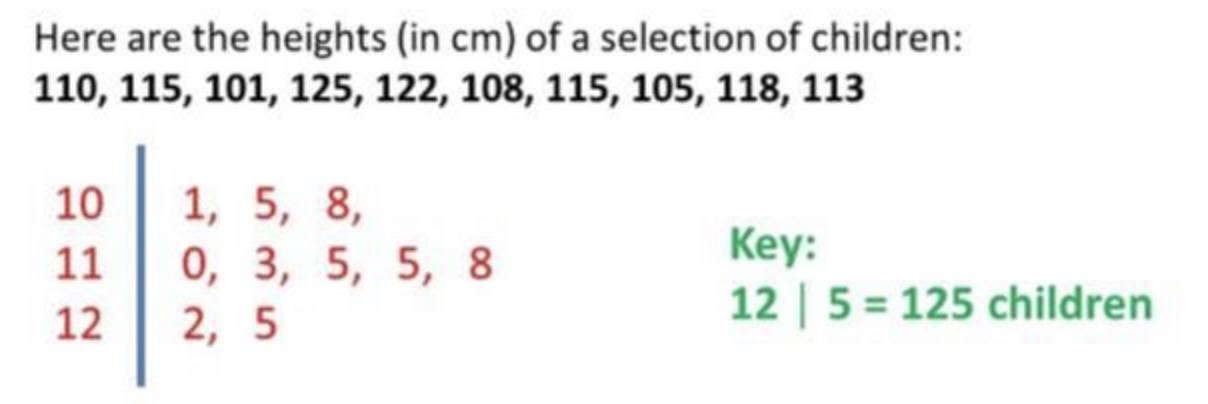
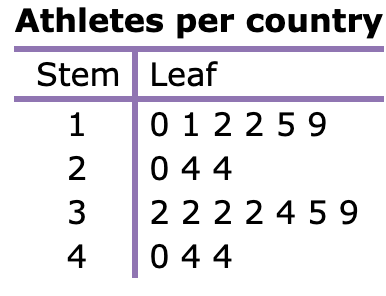
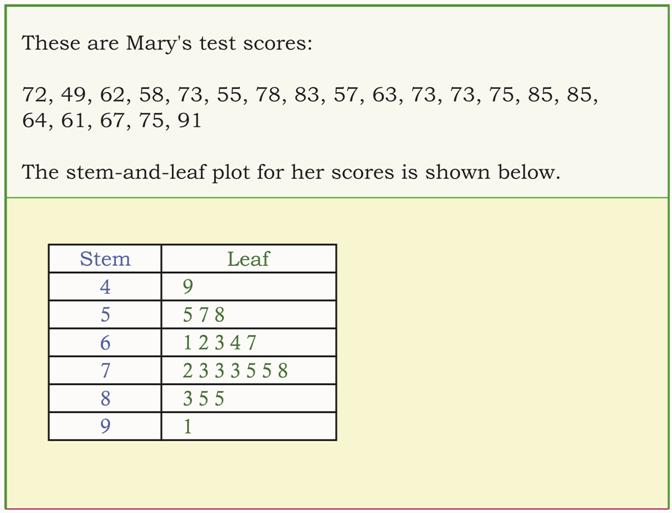
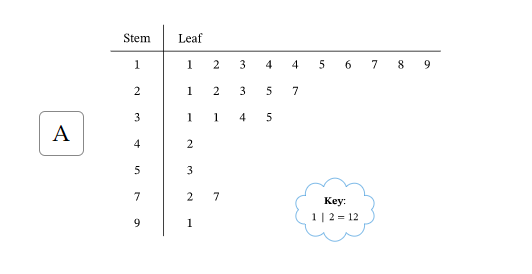
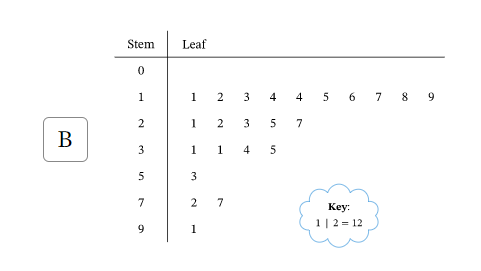
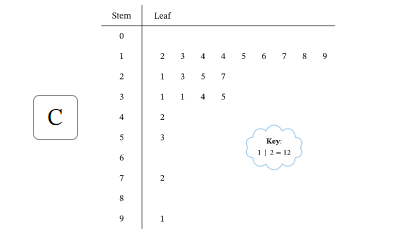
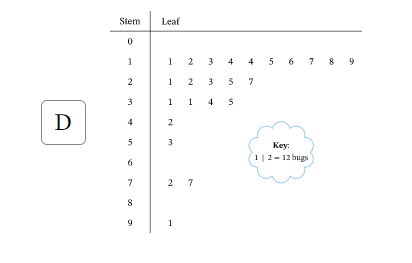
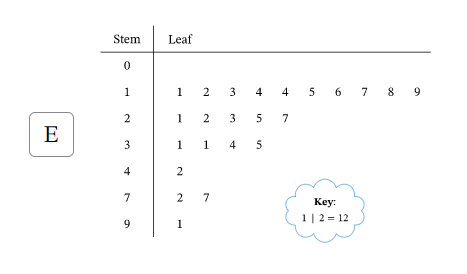
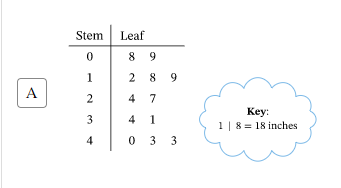
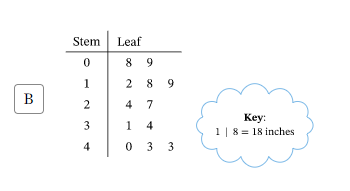
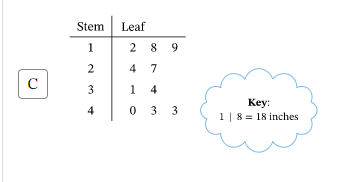
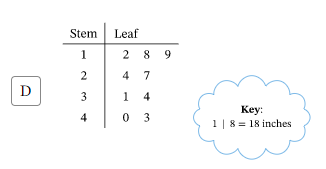
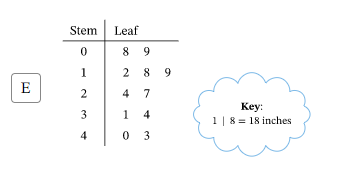
Which options show the stem and leaf diagram for the data shown?
4.
Multiple Choice
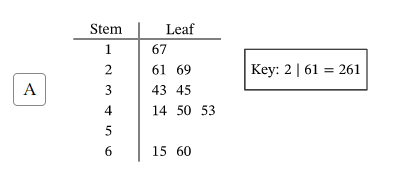
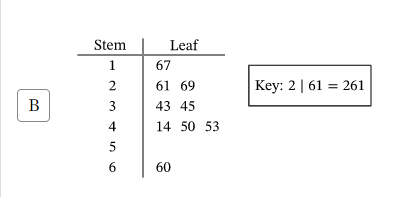
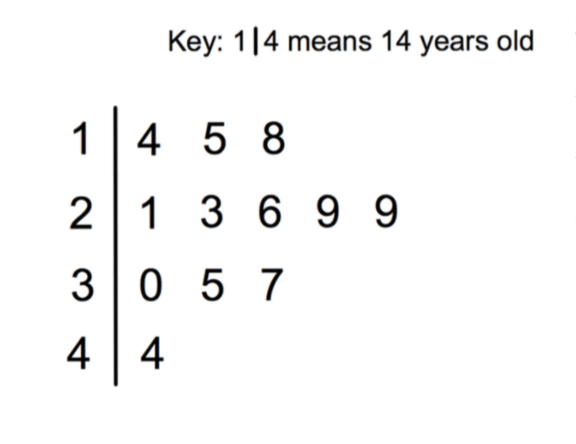
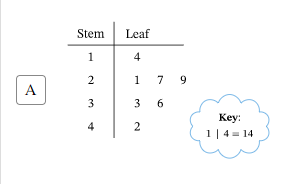
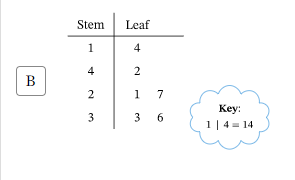
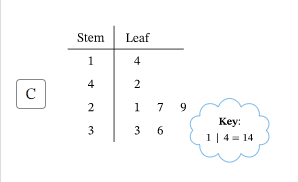
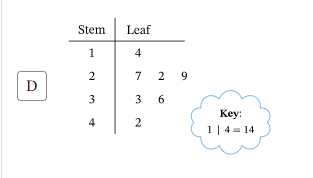
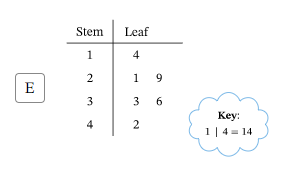
Which of the following stem and leaf diagrams represent the data below;
14,42,21,33,36,27,29.
5.
Multiple Choice
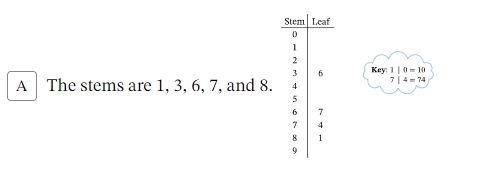
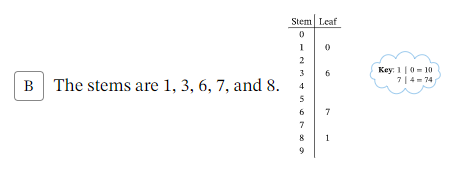
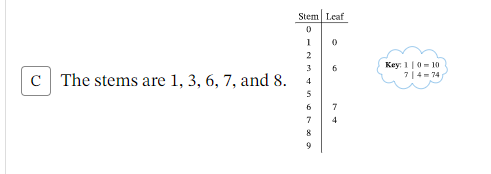
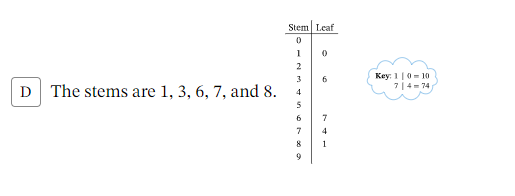
Which stem and leaf diagram represents the data below;
67, 81, 74, 10, and 36.
6.
Multiple Choice

Explore this activity with a free account
Find a similar activity
Create activity tailored to your needs using
.svg)

Box and Whisker Plots
•
6th - 8th Grade

Box Plots
•
7th - 8th Grade

Histograms
•
6th Grade

Data Handling Assessment
•
2nd - 3rd Grade

Mean, Median, Mode, Box and Whisker
•
9th - 12th Grade

Dot Plots
•
4th Grade

Descending and Ascending Order
•
1st - 3rd Grade

Analyzing Histograms
•
9th Grade
