Tape Charts and Motion Graphs
Assessment
•
Evelyn Dellomas
•
Science
•
7th Grade
•
19 plays
•
Hard
Improve your activity
Higher order questions
Match
•
Reorder
•
Categorization
.svg)
actions
Add similar questions
Add answer explanations
Translate quiz
Tag questions with standards
More options
11 questions
Show answers
1.
Multiple Choice
What is a ticker tape diagram?
A line of dots drawn on a page.
A line of dots created by pulling ticker tape through a device that makes impressions on the tape at regular intervals. It represents the motion of the object that pulled the tape.
A line of dots created by pulling ticker tape through a device that makes impressions on the tape at regular intervals. The dots are random and cannot be analyzed.
A line of dots created by a machine that puts dots on tape at positions of your choice.
A diagram of a piece of ticker tape.
2.
Multiple Choice
What does it tell you if the dots on a piece of ticker tape are close together?
The object was moving (relatively) slowly.
The object was moving (relatively) fast.
The object was speeding up.
The object was slowing down.
The object wasn't moving at all.
3.
Multiple Choice
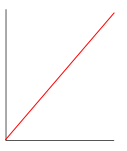
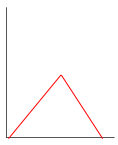
Which of the following pieces of ticker tape represent an object that is speeding up? (Assuming the ticker tape was pulled to the LEFT, through the device.)


4.
Multiple Choice
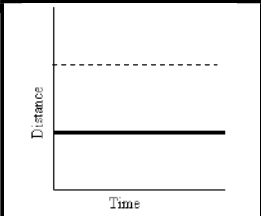
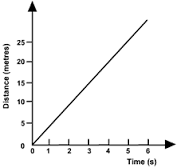
What does the solid line on this graph represent?
Constant speed
Acceleration
At rest
deceleration
5.
Multiple Choice
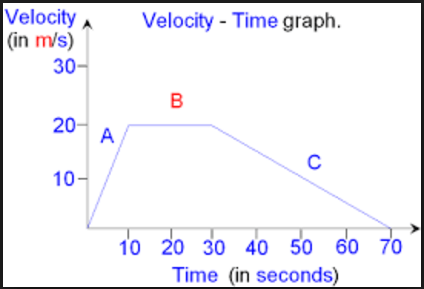
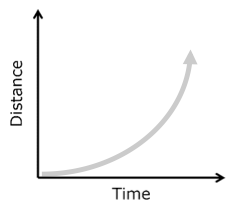
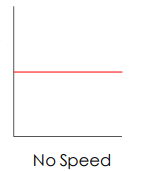
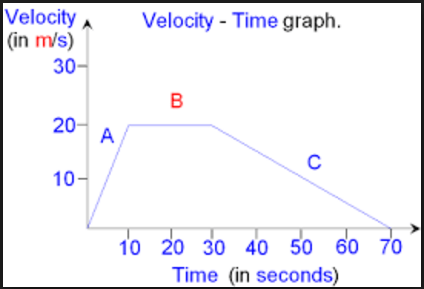
Positive acceleration
Negative acceleration
Constant Velocity
Not moving
6.
Multiple Choice
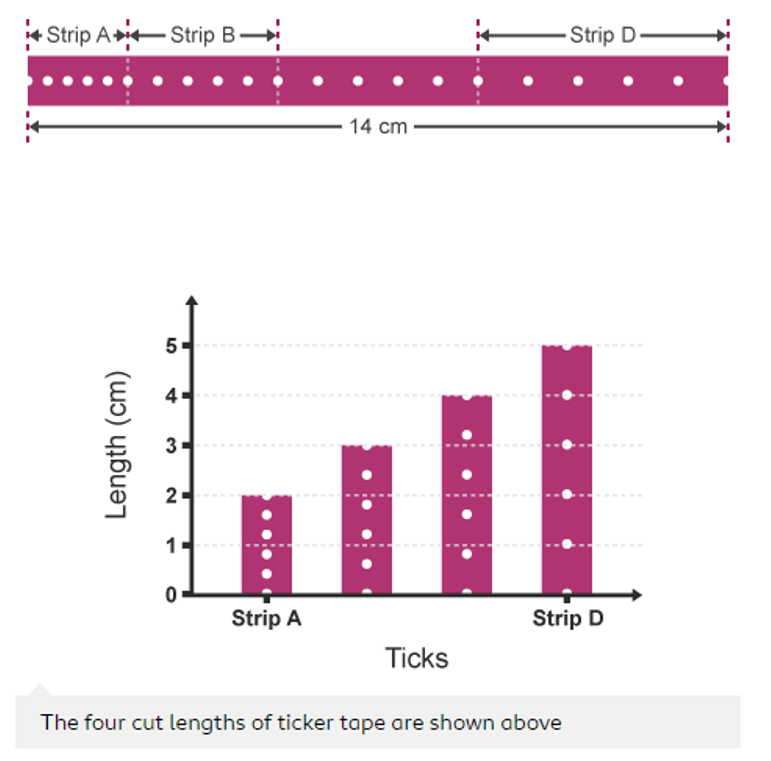
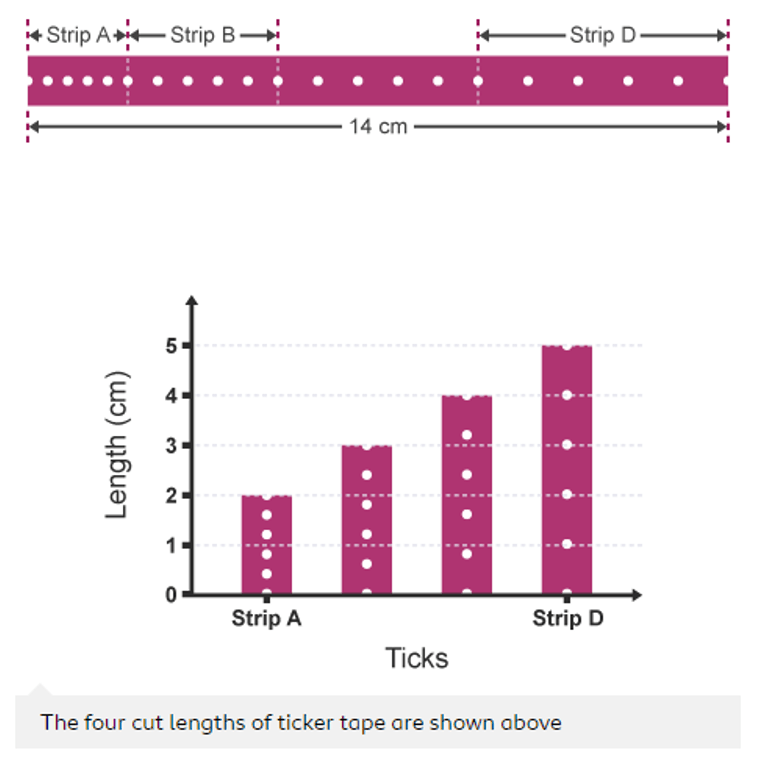
Calculate the mean velocity of the trolley for Strip A
0.2 cm/s
2 cm/s
20 cm/s
0.005 cm/s

Explore this activity with a free account
Find a similar activity
Create activity tailored to your needs using
.svg)

Speed, Velocity & Acceleration
•
6th - 8th Grade

Analyze Motion Graphs
•
6th Grade

Motion
•
5th Grade

Light Energy
•
1st Grade

Motion Along a Straight Line
•
University

Intro to Kinematics
•
10th Grade

Light
•
4th Grade

Speed, Velocity, and Acceleration
•
7th Grade
