Working with real life graphs
Assessment
•
S McMorrow
•
Mathematics
•
8th - 10th Grade
•
8 plays
•
Hard
Improve your activity
Higher order questions
Match
•
Reorder
•
Categorization
.svg)
actions
Add similar questions
Add answer explanations
Translate quiz
Tag questions with standards
More options
10 questions
Show answers
1.
Open Ended
Evaluate responses using AI:
OFF
2.
Fill in the Blank
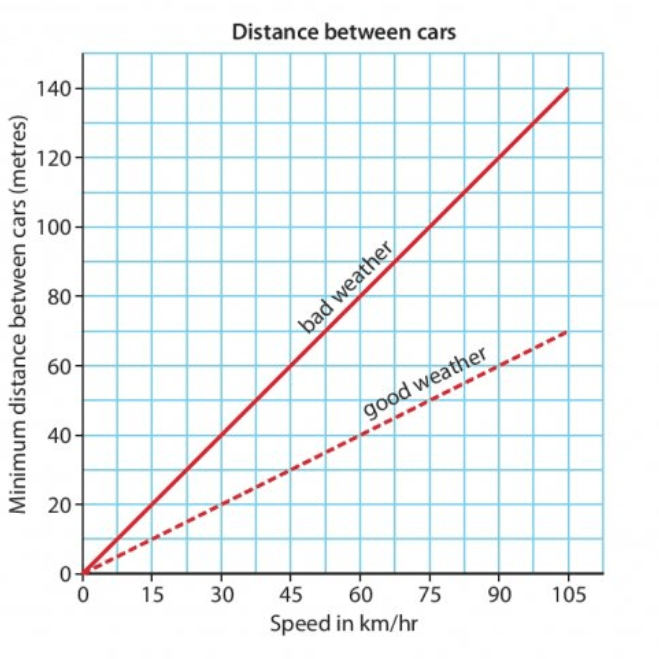
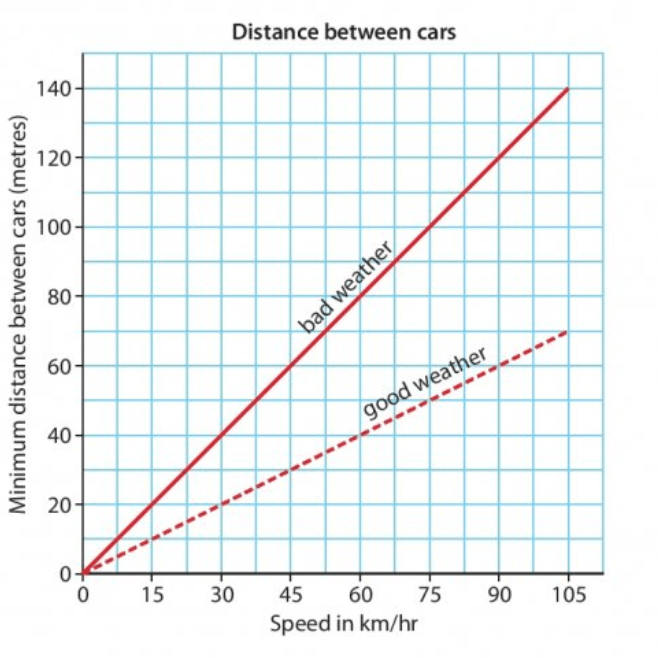
The following graphs gives the shortest braking distances that should be between cars at different speeds.
Ed is driving his car at 60km per hour in poor weather. What should the shortest distance he should be from the car in front?
3.
Fill in the Blank
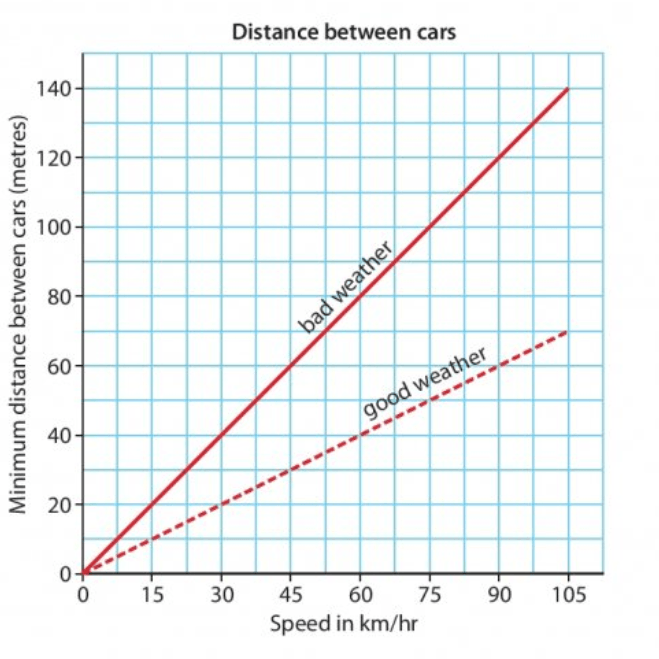
Fay is driving in good weather at 90km/hr. What is the shortest distance that she should be from the car in front?
4.
Fill in the Blank
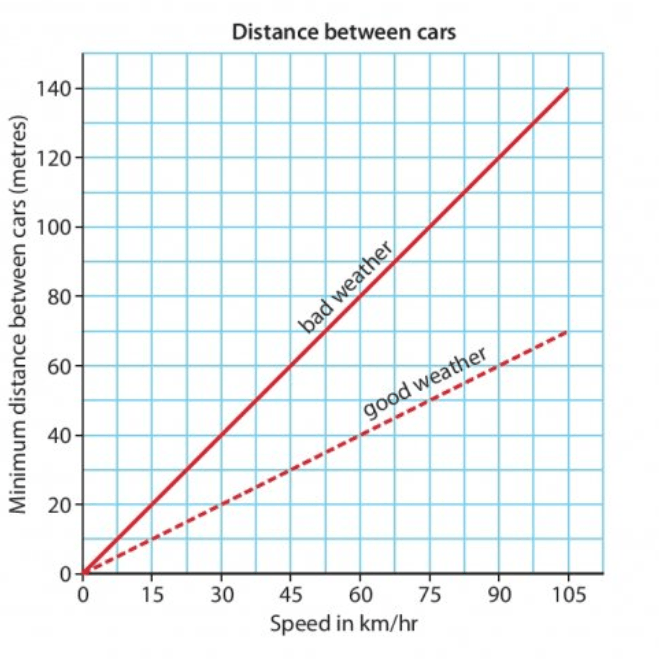
Mr Shaw is driving 70m behind another car. What is the fastest speed that he should be driving at?
5.
Fill in the Blank
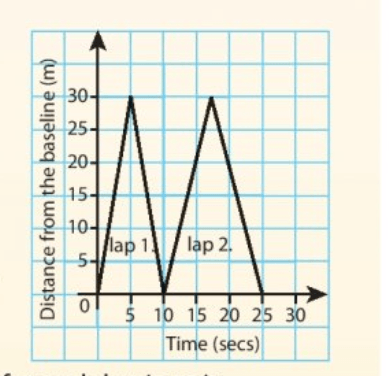
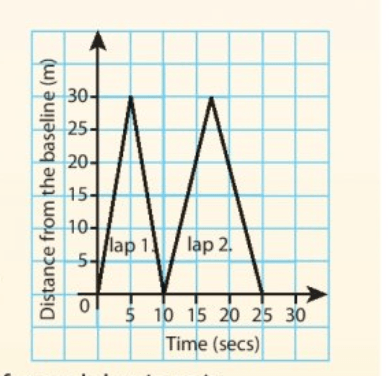
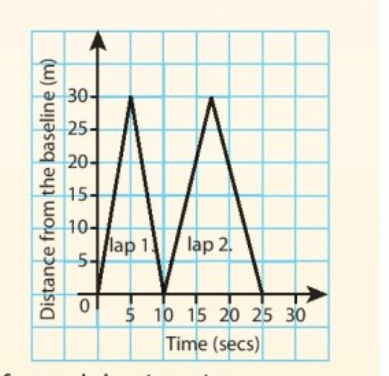
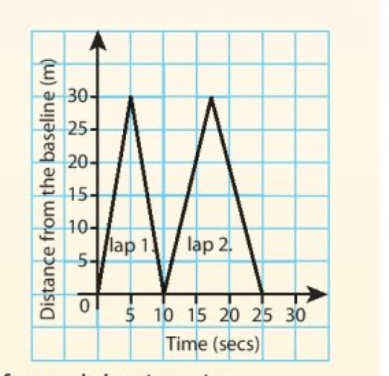
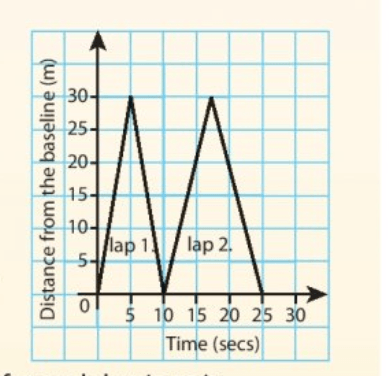
In a fitness test a student runs from the baseline in the gym to the halfway line and back again.
This is called a lap. The results of students A's test are shown. How far is the baseline from the halfway line?
6.
Fill in the Blank
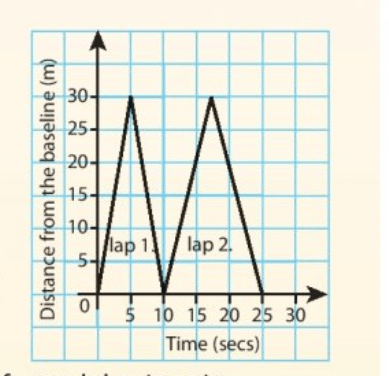
How long did lap 1 take?

Explore this activity with a free account
Find a similar activity
Create activity tailored to your needs using
.svg)

Distance, Rate, and Time
•
6th Grade

Integral Calculus
•
12th Grade

Story Graphs
•
8th Grade

Qualitative Graphs
•
8th Grade

Graphing Stories
•
9th - 12th Grade

Graphing Stories
•
7th - 8th Grade

Interpreting Graphs
•
8th Grade

Applications of Straight Line Graphs
•
8th Grade
