BTEC DIT Comp1 Interfaces & Project Management
Assessment
•
Abdi Yusuf
•
8th - 10th Grade
•
Hard
Improve your activity
Higher order questions
Match
•
Reorder
•
Categorization
.svg)
actions
Add similar questions
Add answer explanations
Translate quiz
Tag questions with standards
More options
20 questions
Show answers
1.
Multiple Choice
What is the use of Gantt Chart?
to show the profit in a system
to show data analysis
to show the progress of tasks for a project
to show data calculation of a project
2.
Multiple Choice
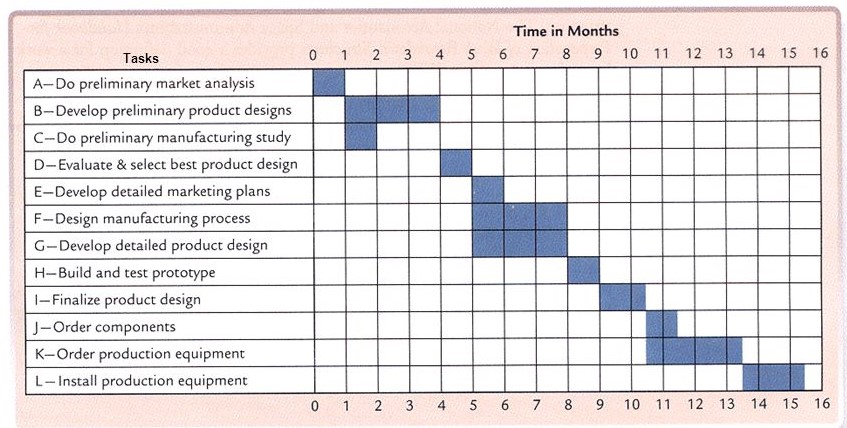
What type of diagram is this?
PERT
Dataflow diagram
Bar Chart
Gantt Chart
3.
Multiple Choice

How long does it take to complete task F?
1 Month
3 Months
6 Months
8 Months
4.
Multiple Choice

Identify the longest task?
Fill Kettle
Boil Kettle
Put tea in cup
Put sugar in cup
Get milk out of fridge
5.
Multiple Choice

Visualisation Diagram
Mockup
Moodboard
Mindmap
6.
Multiple Choice

Which document is this?
Moodboard
Mind Map
Storyboard
Script
Work Plan

Explore this activity with a free account
Find a similar activity
Create activity tailored to your needs using
.svg)

Network Hardware
•
9th - 11th Grade

Python Basics
•
7th - 9th Grade

Processor Components
•
11th - 12th Grade

Operating Systems
•
12th Grade - University

Computational Thinking
•
10th Grade

Cyber Security Threats
•
12th Grade

Protocols & Layers
•
8th - 10th Grade

Computer Hardware Assessment
•
7th Grade
