Statistics / Grade 9
Assessment
•
Prabakaran Praba
•
Mathematics
•
9th Grade
•
158 plays
•
Hard
Improve your activity
Higher order questions
Match
•
Reorder
•
Categorization
.svg)
actions
Add similar questions
Add answer explanations
Translate quiz
Tag questions with standards
More options
30 questions
Show answers
1.
Multiple Choice

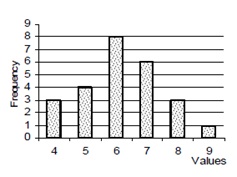
A set of drivers were asked about the number of accidents made in one year. Their answers were abbreviated in the following table:
The total number of surveyed drivers is:
20
70
4
10
2.
Multiple Choice

A set of drivers were asked about the number of accidents made in one year. Their answers were abbreviated in the following table:
The number of drivers that made no accidents is:
0
3
5
7
3.
Multiple Choice

A set of drivers were asked about the number of accidents made in one year. Their answers were abbreviated in the following table:
The percentage of drivers who made 4 accidents is:
4%
20%
25%
60%
4.
Multiple Choice

A set of drivers were asked about the number of accidents made in one year. Their answers were abbreviated in the following table:
The mean (average) number of accidents is performed by a driver is:
1.5
2
2.5
1
5.
Multiple Choice
Knowing that the total of a certain surveyed population is 25. The central angle of a value whose frequency 5 is:
6.
Multiple Choice
The five grades of a student over 20 are: 10 ; 12 ; 13 ; 16 and 19. The average grade is:
13
14
14.5
15

Explore this activity with a free account
Find a similar activity
Create activity tailored to your needs using
.svg)

Data Handling
•
7th Grade

Data Handling
•
7th Grade

Data Handeling
•
6th Grade

Time, Multiplication and Division
•
3rd Grade

Statistics
•
University

Data Handling
•
8th Grade

Analyzing Histograms
•
9th Grade

Sets
•
10th Grade
