
Graphing in Science
Assessment
•

Jared Jackson
•
Science, Mathematics
•
6th - 8th Grade
•
466 plays
•
Medium
Improve your activity
Higher order questions
Match
•
Reorder
•
Categorization
.svg)
actions
Add similar questions
Add answer explanations
Translate quiz
Tag questions with standards
More options
10 questions
Show answers
1.
Multiple Choice
You need to take a survey at school to see which type of lunch food is most preferred by 7th grade students.
Which type of graph would be best to display the data?
Line Graph
Bar Graph or Pie Chart
Scatter Plot
Funnel Chart
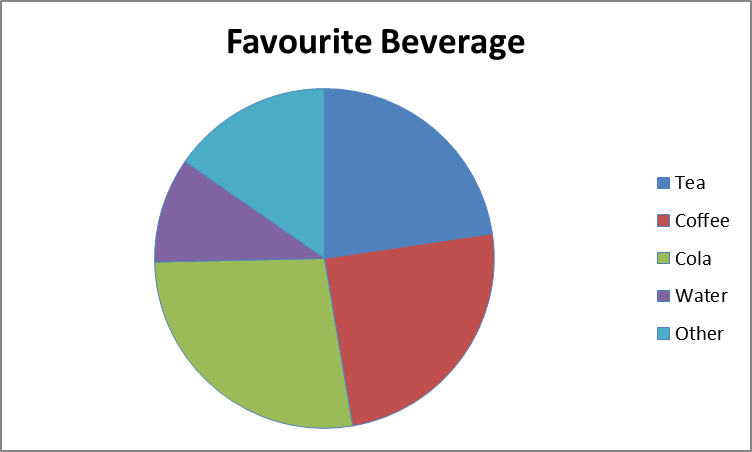
2.
Multiple Choice
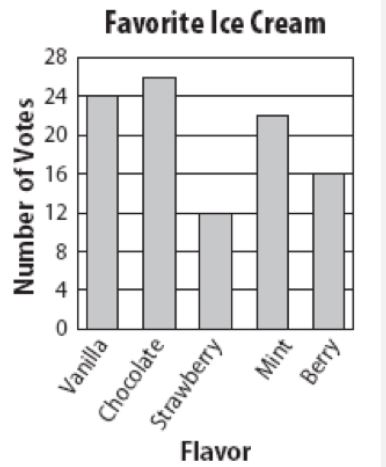
How many total people took part in the survey?
50
150
100
200
3.
Multiple Choice
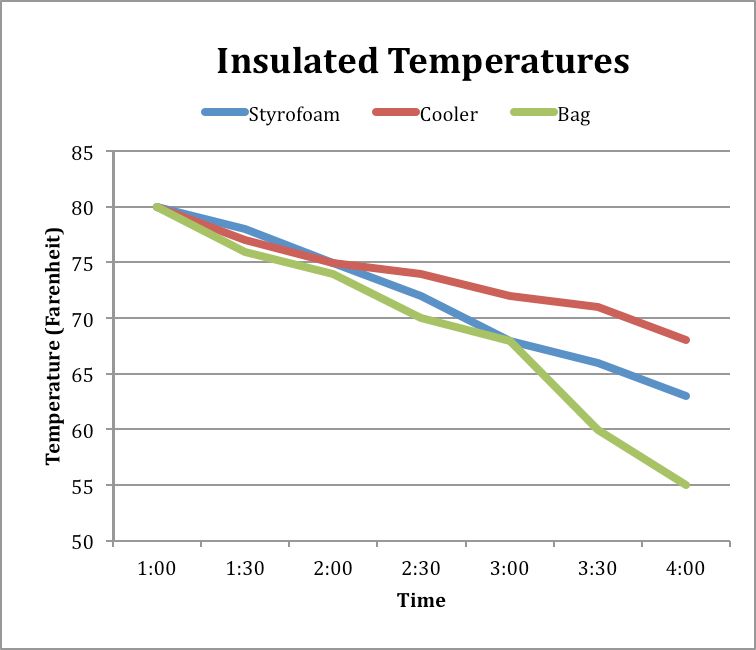
What was the temperature of the liquid in the Styrofoam container at 4:00?
55 degrees
68 degrees
73 degrees
63 degrees
4.
Multiple Choice
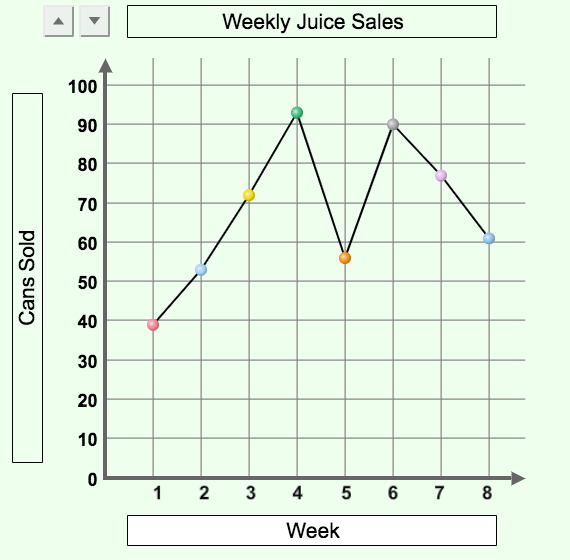
Identify the dependent variable by looking at the graph.
Weeks
Weekly Juice Data
Cans Sold
Indirect Relationship
5.
Multiple Choice
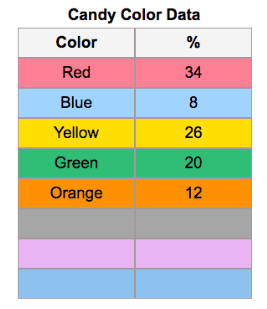
Based on the table provided, which type of graph would be best for the data?
Line graph
Bar Graph
Pie Chart
Scatter Plot
6.
Multiple Choice
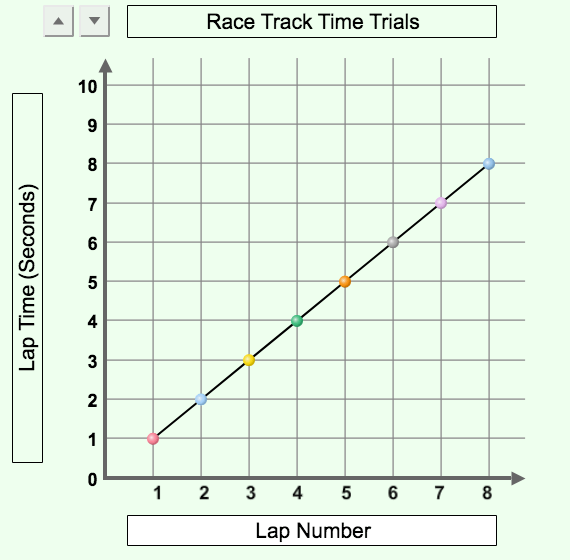
A car is timed around a race track for 8 laps. The laps are numbered in order. Look at the relationship between Lap Number and Lap Time (seconds).
What type of relationship is this?
Direct
Inverse
Diagonal
Horizontal


Explore this activity with a free account
Find a similar activity
Create activity tailored to your needs using

Graphing and Models
•
6th - 8th Grade
Phtosynthesis
•
KG
Newtons Laws of Motion
•
2nd Grade
Graphing Relationships
•
8th Grade
Renewable Energy
•
11th - 12th Grade
Succession & Biogeochemical Cycles
•
KG
Scientific Variables Exit Ticket
•
KG
Scatter Plots and Correlation
•
7th Grade