Chapter 2 Test Review
Assessment
•

Angela Sage
•
Mathematics
•
9th - 12th Grade
•
9 plays
•
Medium
Improve your activity
Higher order questions
Match
•
Reorder
•
Categorization
.svg)
actions
Add similar questions
Add answer explanations
Translate quiz
Tag questions with standards
More options
14 questions
Show answers
1.
Multiple Choice
Page 137 #T.2.1 (Interpreting Percentiles)
a
b
c
d
e
Answer explanation
The percentile tells you the percent of the data set that is at or below a specific piece of data.
2.
Multiple Choice
Page 138 #T.2.5 (Calculate the standard deviation from a percentile.)
a
b
c
d
e
Answer explanation
15% is the area to the right of 60 inches. You need to look in Table A for 0.85, which is the area to the left. Then use the corresponding z-score and the z-score formula to solve for the standard deviation.
3.
Multiple Choice
Page 138 #T.2.7 (Calculate the standard deviation using the empirical rule)
a
b
c
d
e
Answer explanation
Using the 68-95-99.7 rule, if 99.7% of the data lies between 5 ft & 7ft, these numbers are both 3 standard deviations from the mean. The mean is between them at 6ft., so the standard deviation must be 1/3 of a foot (4 inches).
4.
Multiple Choice
Page 138 #T.2.10 (Comparing Standardized Scores)
a
b
c
d
e
Answer explanation
Calculate the z-scores for each student. The student with the higher z-score performed better compared to their peers.
5.
Multiple Choice
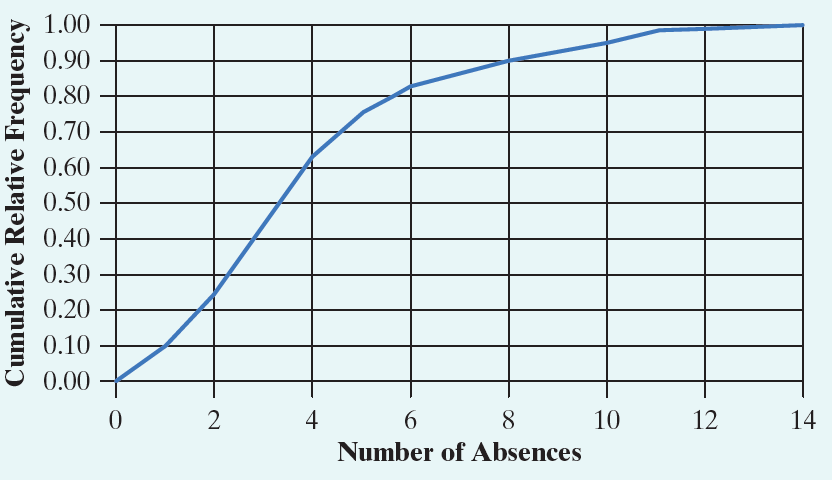
The number of absences during fall semester was recorded for each student in a large elementary school. The distribution of absences is displayed in the following cumulative relative frequency graph. What is the IQR for the distribution of absences?
1
2
3
5
1
Answer explanation
Q1 is found at the 25th percentile. Q3 is found at the 75th percentile. Subtract those values to find your IQR.
6.
Multiple Choice
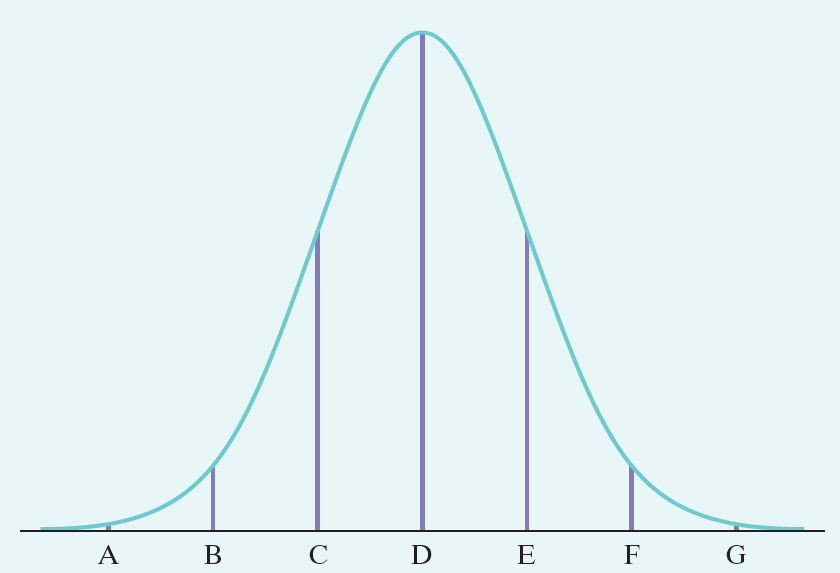
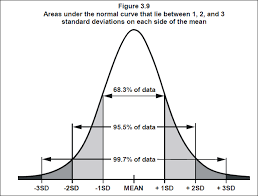
The weights of laboratory cockroaches follow a Normal distribution with mean 80 grams and standard deviation 2 grams. The following figure is the Normal curve for the distribution of weights. About what percent of the cockroaches have weights between 76 and 84 grams?
99.7%
95%
68%
47.5%
34%
Answer explanation
Use the empirical Rule (68-95-99.7 rule). Since 76 & 84 are both 2 standard deviation from the mean, this rule is easily applied.

Explore this activity with a free account
Find a similar activity
Create activity tailored to your needs using
.svg)

Box and Whisker Plots
•
6th - 8th Grade

Box and Whisker Plots
•
9th - 12th Grade

Box Plots
•
9th - 10th Grade

Histograms
•
6th Grade

Mean, Median, Mode, Box and Whisker
•
9th - 12th Grade

Levels of Measurements
•
11th Grade - University

Dot Plots
•
4th Grade

Analyzing Histograms
•
9th Grade
