Data Analysis (4.9A/4.9B)
Assessment
•

Charlie Middlebrooks
•
Mathematics
•
4th Grade
•
559 plays
•
Medium
Improve your activity
Higher order questions
Match
•
Reorder
•
Categorization
.svg)
actions
Add similar questions
Add answer explanations
Translate quiz
Tag questions with standards
More options
12 questions
Show answers
1.
Multiple Choice
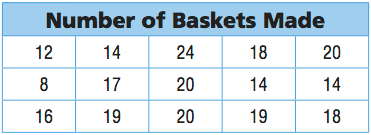
Greg made a table showing the number of baskets he made during 15 basketball practices.
If Greg were to make a frequency table from this data, what number would he use to show the number of times he made 14 baskets?
5
0
3
4
2.
Multiple Choice
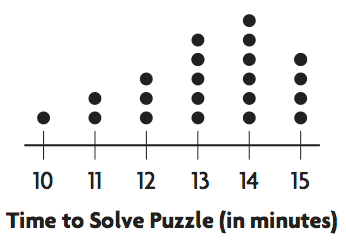
What number represents the time that the greatest number of students solved the puzzle?
12
13
14
15
3.
Multiple Choice
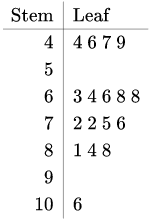
This shows how many baseball cards a group of friends have in their collections. How many friends have baseball card collections with more than 70 cards?
7
8
9
4
4.
Multiple Choice
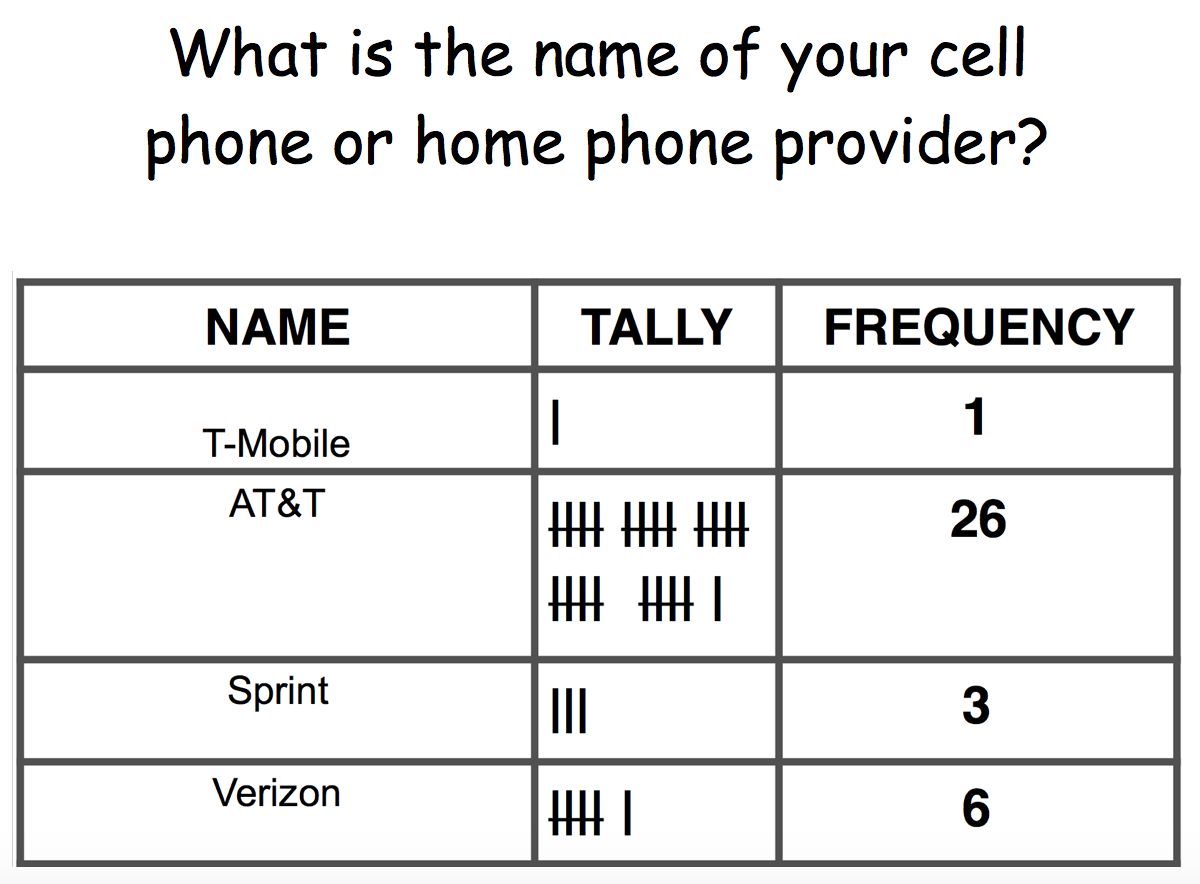
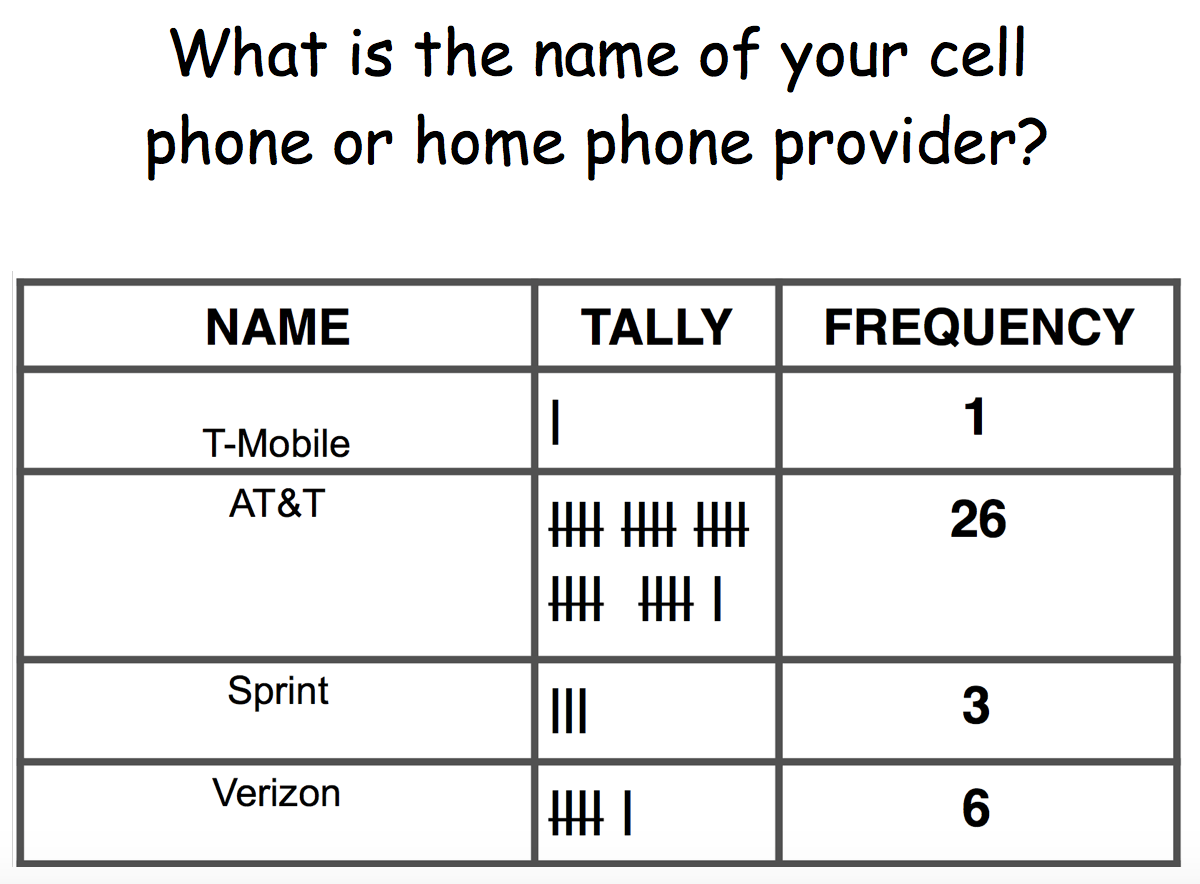
35
10
26
36
5.
Multiple Choice
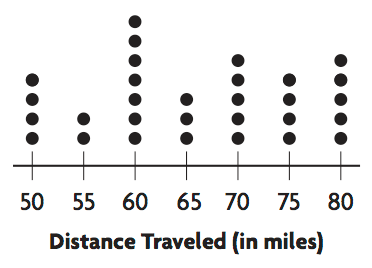
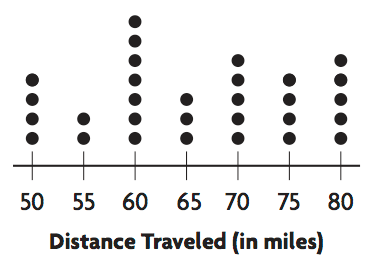
How many more days did Jose travel 70 miles than 65 miles?
5
2
1
3
6.
Multiple Choice
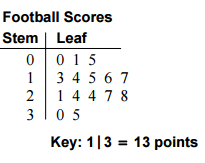
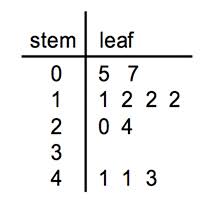
15
12
24
14

Explore this activity with a free account
Find a similar activity
Create activity tailored to your needs using
.svg)

Coins
•
KG

Polynomial Addition and Subtraction
•
KG

Numeros
•
KG

Tens and Ones
•
KG

Fair Share
•
KG

Addition
•
KG

Exponential Relationships
•
KG

Function
•
KG
