
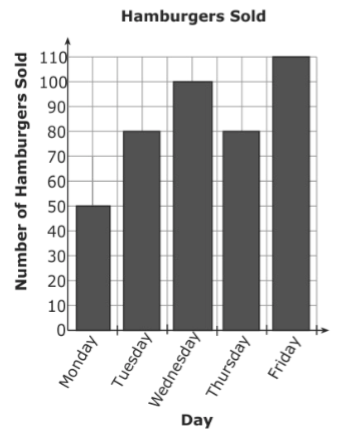
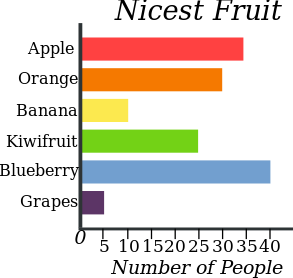
Bar Graph
Assessment
•

Rana Zanoona
•
Mathematics
•
3rd Grade
•
1K plays
•
Medium
Improve your activity
Higher order questions
Match
•
Reorder
•
Categorization
.svg)
actions
Add similar questions
Add answer explanations
Translate quiz
Tag questions with standards
More options
14 questions
Show answers
1.
Multiple Choice
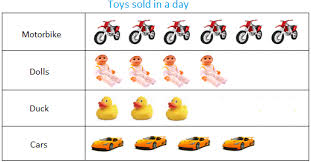
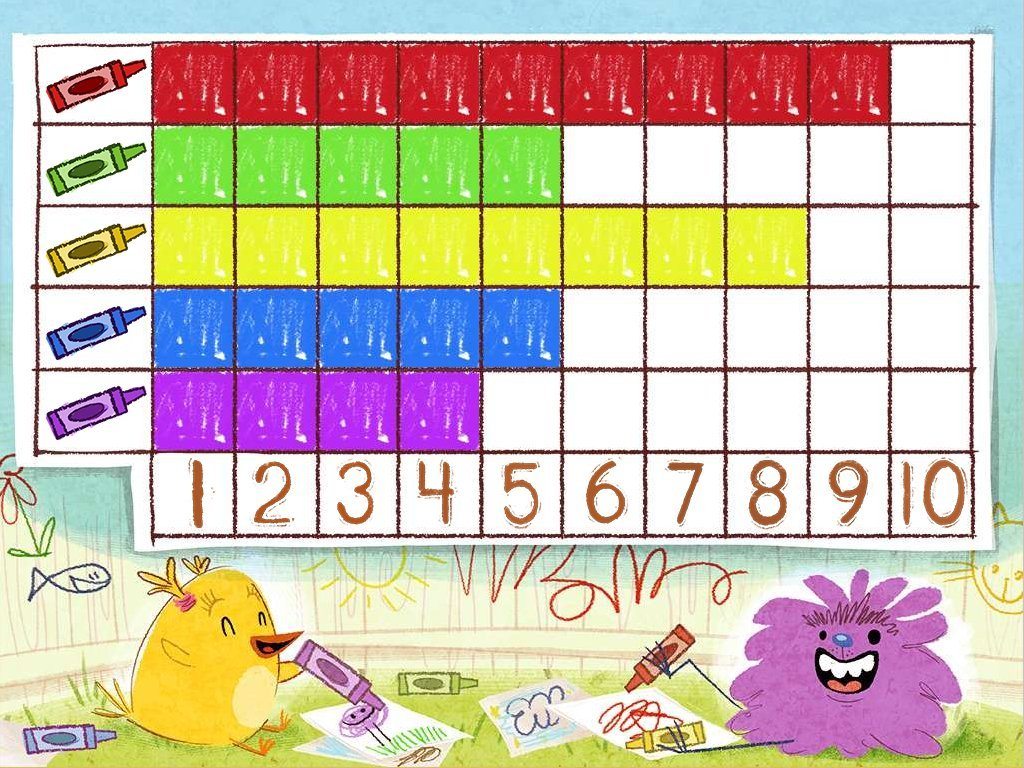
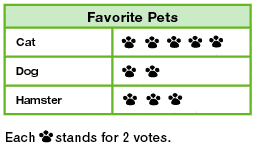
bar graph
pictograph
tally chart
2.
Multiple Choice
bar graph
pictograph
tally chart
3.
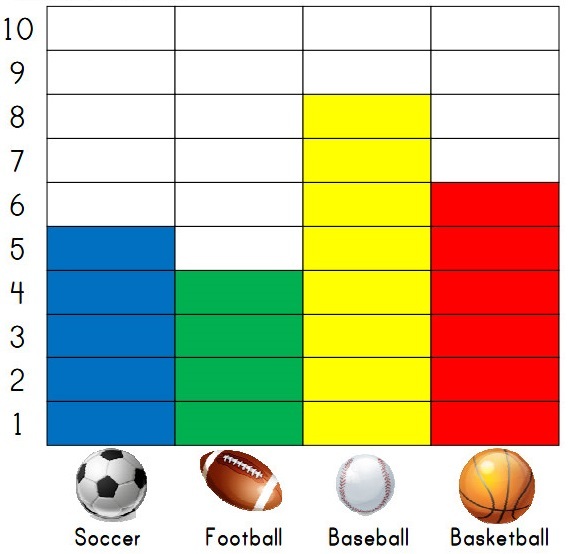
Multiple Choice
5
4
8
6
4.
Multiple Choice
9
4
10
2
5.
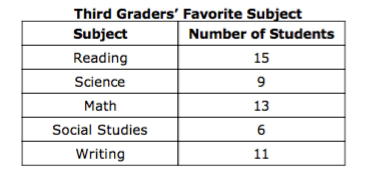
Multiple Choice
9
3
13
2
6.
Multiple Choice
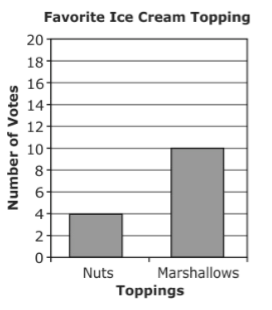
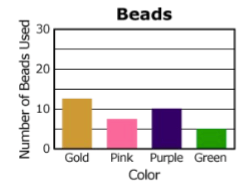
Students voted for their favorite ice cream topping. How many more students chose marshmallows than chose nuts?
4
6
10


Explore this activity with a free account
Find a similar activity
Create activity tailored to your needs using

Smallest Number
•
KG
Revision
•
KG
Number Pairs
•
1st Grade
Months Of Year
•
1st Grade
Subtraction
•
KG - 1st Grade
Ordinal Numbers
•
KG
Doubling and Halving
•
KG
Writing Equations
•
9th Grade