Statistics
Assessment
•
Khadeeja Saeed
•
Mathematics
•
4th Grade
•
78 plays
•
Medium
Improve your activity
Higher order questions
Match
•
Reorder
•
Categorization
.svg)
actions
Add similar questions
Add answer explanations
Translate quiz
Tag questions with standards
More options
10 questions
Show answers
1.
Fill in the Blank
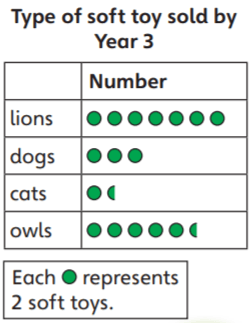
The pictogram shows the number of soft toys Year 3 sold at a summer fair.
a) Which soft toys did Year 3 sell more than 10 of?
2.
Fill in the Blank
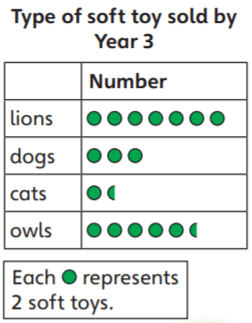
b) Each soft toy sold for £5.
How much money did selling lions and dogs make?
3.
Fill in the Blank

Each counter represents ________ soft toys.
4.
Multiple Choice
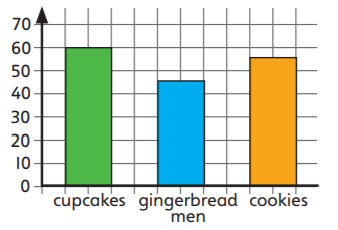
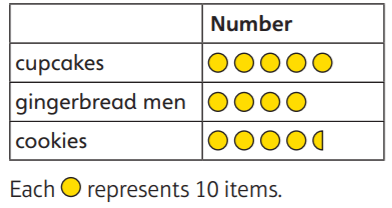
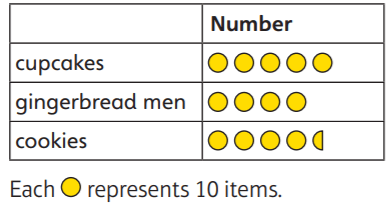
This is a ________________________.
bar chart
pictogram
line graph
table
5.
Multiple Choice
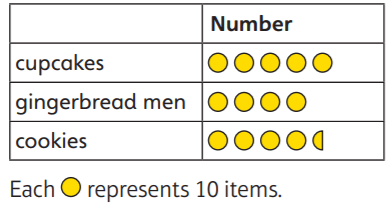
This is a ________________________.
bar chart
pictogram
line graph
table
6.
Multiple Choice
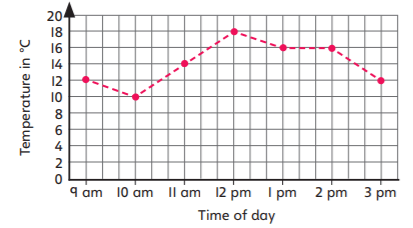
This is a ________________________.
bar chart
pictogram
line graph
table

Explore this activity with a free account
Find a similar activity
Create activity tailored to your needs using
.svg)

Revision
•
KG

Number Pairs
•
1st Grade

Months Of Year
•
1st Grade

Subtraction
•
KG - 1st Grade

Math
•
KG

Math
•
KG

Doubling and Halving
•
KG

Writing Equations
•
9th Grade
