P3 Bar graphs
Assessment
•
Syafa Amin
•
Mathematics
•
3rd - 4th Grade
•
137 plays
•
Medium
Improve your activity
Higher order questions
Match
•
Reorder
•
Categorization
.svg)
actions
Add similar questions
Add answer explanations
Translate quiz
Tag questions with standards
More options
15 questions
Show answers
1.
Open Ended
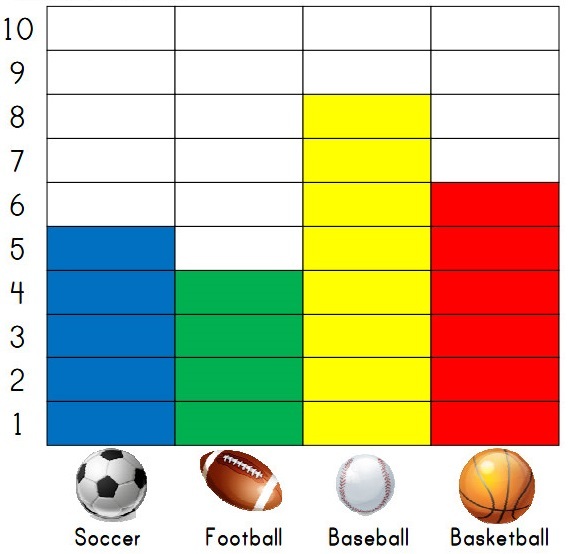
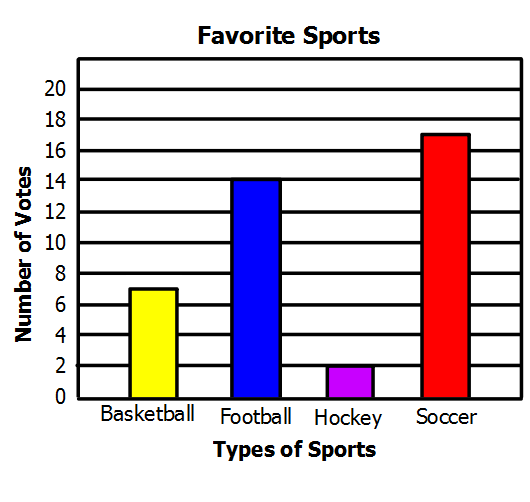
A survey was conducted on people's favourite sports activity. The results were shown in the bar graph. How many people like soccer best?
Evaluate responses using AI:
OFF
2.
Multiple Choice

How many people like football and basketball?
9
4
10
2
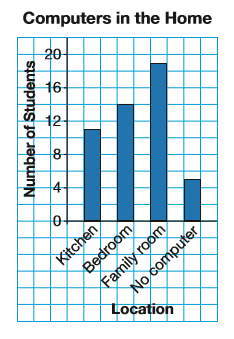
3.
Multiple Choice
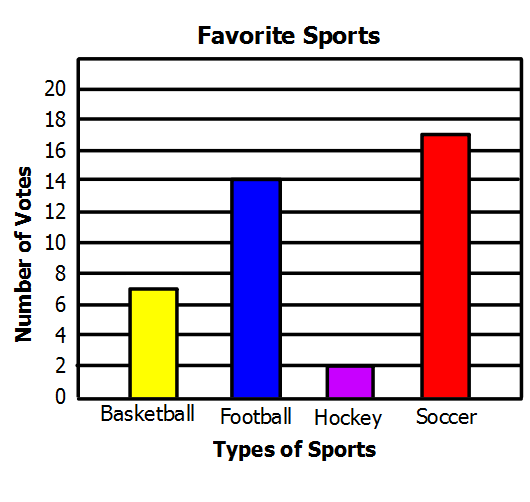
24
15
10
17
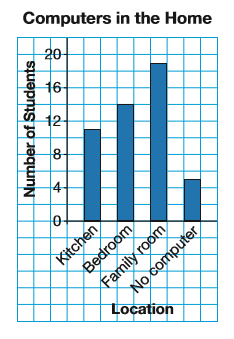
4.
Multiple Choice
38
17
40
50
5.
Multiple Choice
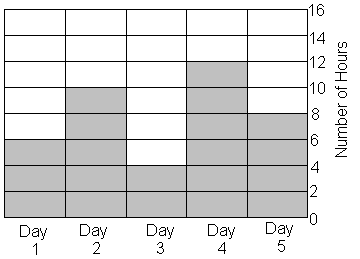
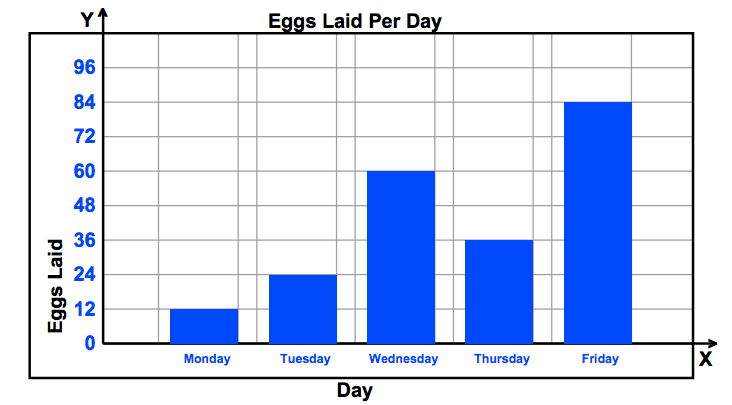
Jamie practiced for her piano recital for 5 days in a row.
What is the sum of hours she practiced on Day 1 and Day 3?
2
4
10
5
6.
Multiple Choice
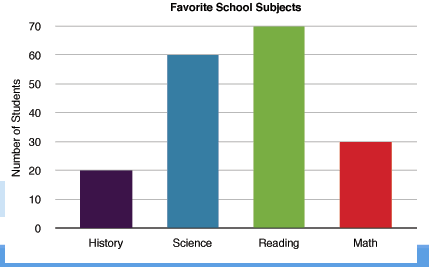
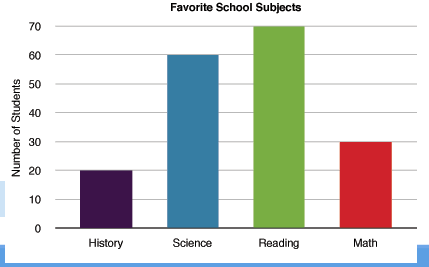
History
Science
Math
Spelling

Explore this activity with a free account
Find a similar activity
Create activity tailored to your needs using
.svg)

Line Plots
•
2nd - 3rd Grade

Venn Diagrams
•
9th - 12th Grade

Multiplying Fractions
•
5th - 6th Grade

Venn Diagram
•
8th - 10th Grade

Two Way Frequency Tables
•
9th - 10th Grade

Percent Proportions
•
7th Grade

Mental Maths
•
3rd Grade

Skip Counting
•
1st Grade
