Interpreting Line Graphs
Assessment
•
Ryan Austin
•
Mathematics
•
9th Grade
•
892 plays
•
Easy
Improve your activity
Higher order questions
Match
•
Reorder
•
Categorization
.svg)
actions
Add similar questions
Add answer explanations
Translate quiz
Tag questions with standards
More options
20 questions
Show answers
1.
Multiple Choice
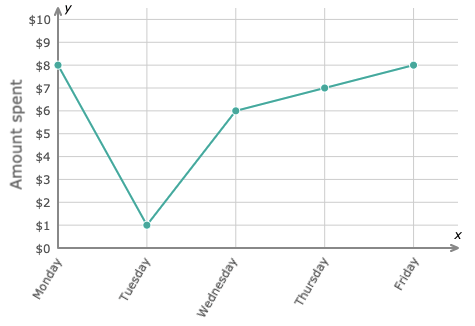
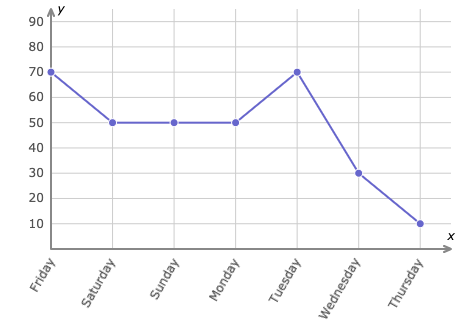
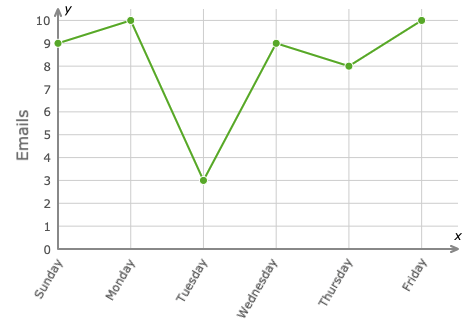
How much money was spent on Thursday?
1
6
7
8
2.
Multiple Choice
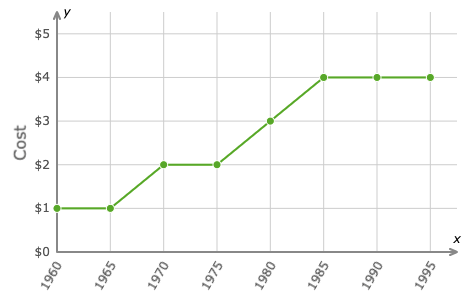
What year did a ticket cost $3.00?
1960
1970
1980
1990
3.
Multiple Choice
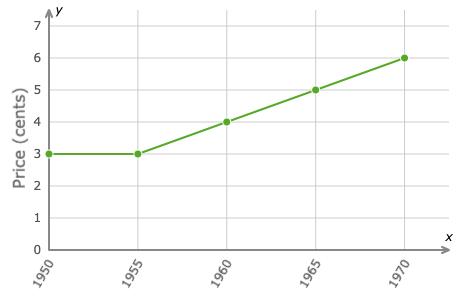
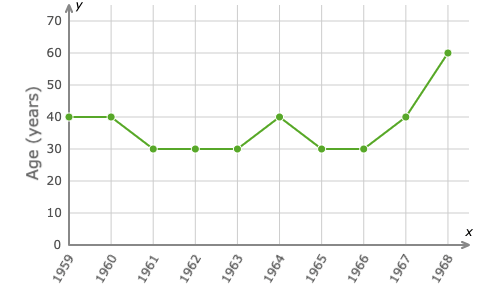
How much was a stamp in 1965?
3 cents
4 cents
5 cents
6 cents
4.
Multiple Choice
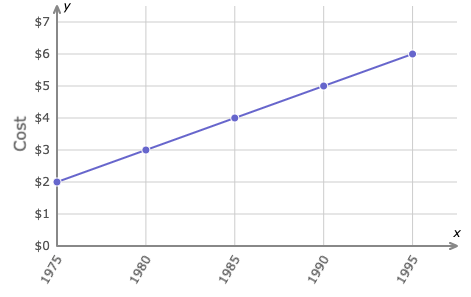
What year did a book cost $4.00?
1980
1985
1990
5.
Multiple Choice
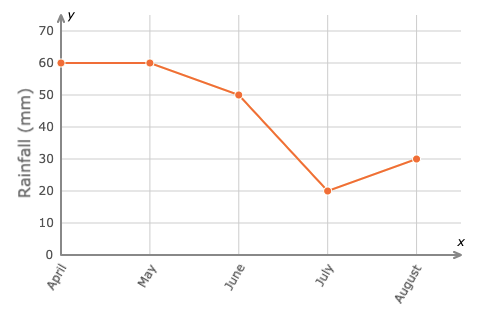
What is the rainfall total for May?
60 mm
50 mm
30 mm
20 mm
6.
Multiple Choice
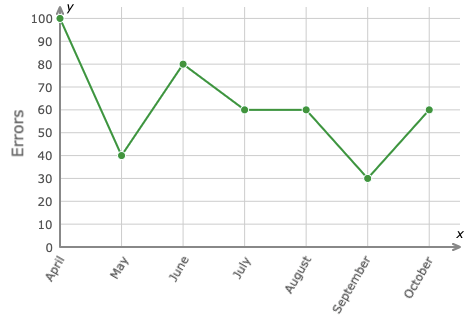
How many errors were made in June?
100
80
60
40

Explore this activity with a free account
Find a similar activity
Create activity tailored to your needs using
.svg)

Ordinal Numbers
•
1st Grade

Add
•
1st Grade

Coins
•
KG - 1st Grade

Describing and Identifying Shapes
•
KG

Associative Property of Addition
•
1st Grade

Think About Counting
•
1st Grade

Simple Calculator Quiz
•
1st Grade
