Phase changes and Latent Heat
Assessment
•
D Gaskins
•
Chemistry
•
10th Grade
•
Hard
Improve your activity
Higher order questions
Match
•
Reorder
•
Categorization
.svg)
actions
Add similar questions
Add answer explanations
Translate quiz
Tag questions with standards
More options
7 questions
Show answers
1.
Multiple Choice

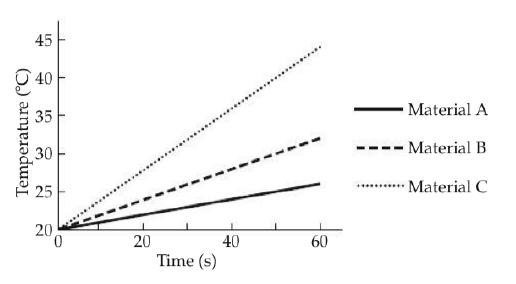
The graph shows the temperature of 1kg samples of three materials, A, B, and C, as they are heated. Heating occurs at a constant rate.
If material A starts to melt at 60 oC. At that point, the line on the graph will __________.
continue on as before
begin to curve upward
become steeper
become horizontal
2.
Multiple Choice

The graph shows the temperature of 1kg samples of three materials, A, B, and C, as they are heated. Heating occurs at a constant rate.
Which material has molecules with the highest average kinetic energy after 40 s of heating?
Material A
Material B
Material C
Impossible to determine from the graph
3.
Multiple Choice
A 45.0-kg sample of ice is at 0.00 oC. How much heat is needed to melt it? For water Lf =334,000 J/kg and Lv =2.256×10⁶ J/kg.
1.50×10⁴ kJ
4.10×10⁶ kJ
0.00 kJ
1.02×10⁵ kJ
4.
Multiple Choice
A system consists of an ice cube floating in a glass of water. The entire system is at 0 oC. Thermal energy is then added slowly to the system, causing half of the ice to melt. What can be said about the resulting temperature of the system?
Greater than 0 oC
Less than 0 oC
Equal to 0 oC
Equal to 100 oC
5.
Multiple Choice
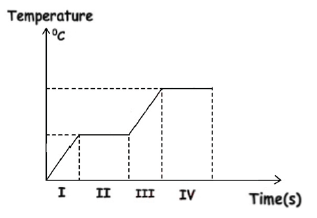
The heat energy required to change 1 kg of a substance from a solid to a liquid state at the same temperature is called ____
specific heat capacity
specific latent heat of vaporization
sensible heat
specific latent heat of fusion
6.
Multiple Choice
What is the thermal energy removed to convert 0.5 kg of water at 0 oC to ice at 0 oC ?
0 J
1.5 × 10⁵ J
3.0 × 10⁵ J
6.0 × 10⁵ J

Explore this activity with a free account
Find a similar activity
Create activity tailored to your needs using
.svg)

Temperature
•
7th - 9th Grade

Specific Heat
•
10th Grade

Calorimetry
•
10th - 12th Grade

Conduction, Convection, Radiation
•
9th - 10th Grade

Specific Heat Calculations
•
10th - 11th Grade

Energy Transfer and Heat Capacity
•
10th Grade

Heat Transfer
•
7th - 8th Grade

Heat and Heat Transfer Review
•
10th - 11th Grade
