Correlation & Correlation Coefficient
Assessment
•
Rachel Lebowitz
•
Mathematics
•
8th - 11th Grade
•
2 plays
•
Easy
Improve your activity
Higher order questions
Match
•
Reorder
•
Categorization
.svg)
actions
Add similar questions
Add answer explanations
Translate quiz
Tag questions with standards
More options
17 questions
Show answers
1.
Multiple Choice

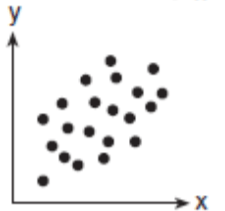
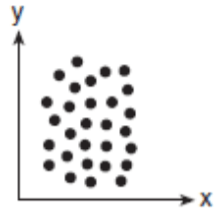
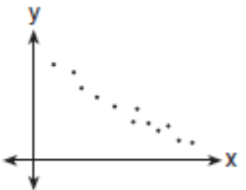
Estimate the correlation coefficient for this scatterplot.
A) r = 1.2
B) r = 0.89
C)r = 0
D) r = -0.89
2.
Multiple Choice
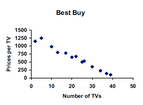
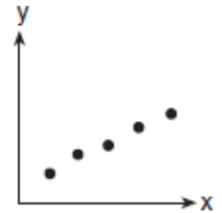
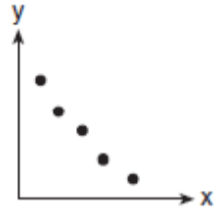
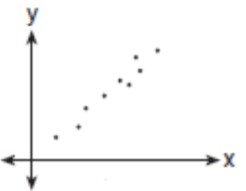
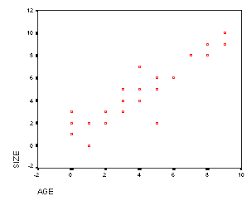
Estimate the correlation coefficient for this scatterplot.
A) r = -0.9
B) r = 1
C) r = 0.9
D) r = -1
3.
Multiple Choice
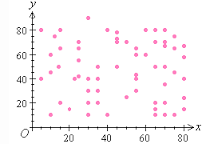
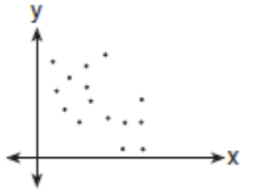
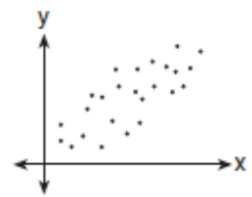
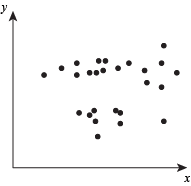
What type of correlation does this graph show?
A) Positive Correlation
B) Negative Correlation
C) No Correlation
4.
Multiple Choice
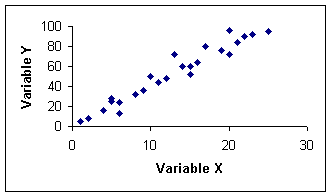
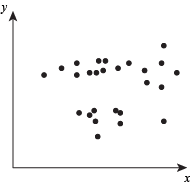
What type of association does this graph have?
Strong Positive
Strong Negative
Weak Positive
Weak Negative
No Correlation
5.
Multiple Choice
r = -0.89
Strong Positive
Weak Positive
Strong Negative
Weak Negative
Perfect Negative
6.
Multiple Choice
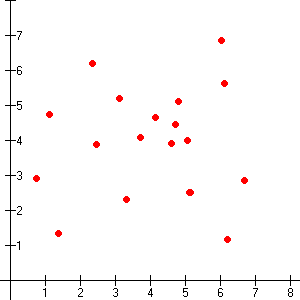
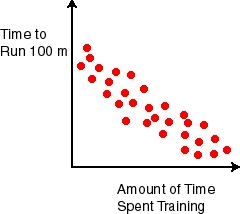
Describe the correlation of the scatterplot.
Negative Correlation
No Correlation
Positive Correlation
Perfect Correlation

Explore this activity with a free account
Find a similar activity
Create activity tailored to your needs using
.svg)

Scatter Plots
•
8th - 9th Grade

Scatter Plots
•
8th Grade

Constant of Proportionality
•
7th Grade

Multiplying Fractions by Whole Numbers
•
4th Grade

Multiplication and Division
•
3rd Grade

Scatter Plots and Trend Lines
•
8th - 9th Grade

Linear Regression & Scatterplots
•
8th - 9th Grade
