Scatter Plots + Linear Model
Assessment
•

Jennifer Tran
•
Mathematics
•
8th - 9th Grade
•
1K plays
•
Medium
Improve your activity
Higher order questions
Match
•
Reorder
•
Categorization
.svg)
actions
Add similar questions
Add answer explanations
Translate quiz
Tag questions with standards
More options
9 questions
Show answers
1.
Multiple Choice
A graph that shows the relationship of two data sets.
A graph drawn using rectangular bars to show how large each value is.
A graph that shows information that is connected in some way.
A graph that shows data changing over time.
2.
Multiple Choice

100 pages
170 pages
60 pages
20 pages
3.
Multiple Choice
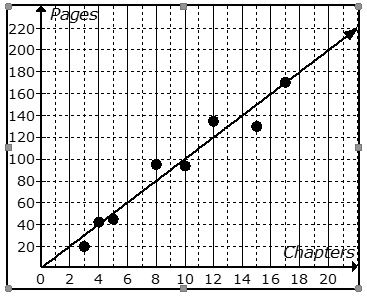
12 chapters
19 chapters
14 chapters
21 chapters
4.
Multiple Choice

What is the age of the tree that is 8 feet tall?
6 Years
7 Years
8 Years
9 Years
5.
Multiple Choice
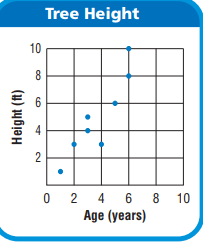
How many trees are 3 years old?
1
2
0
3
6.
Multiple Choice
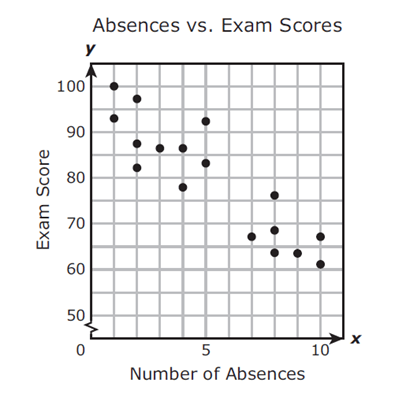
65
92
70
76


Explore this activity with a free account
Find a similar activity
Create activity tailored to your needs using

Scatter Plots
•
8th - 9th Grade
Scatter Plots
•
8th Grade
Constant of Proportionality
•
7th Grade
Multiplying Fractions by Whole Numbers
•
4th Grade
Multiplication and Division
•
3rd Grade
Scatter Plots and Trend Lines
•
8th - 9th Grade
Linear Regression & Scatterplots
•
8th - 9th Grade