
Data Analysis Test Review
Assessment
•

Organization admin
•
Mathematics
•
4th Grade
•
57 plays
•
Medium
Improve your activity
Higher order questions
Match
•
Reorder
•
Categorization
.svg)
actions
Add similar questions
Add answer explanations
Translate quiz
Tag questions with standards
More options
30 questions
Show answers
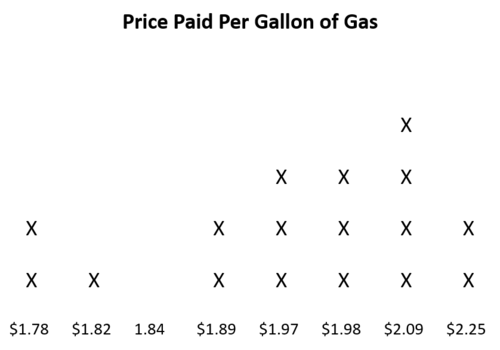
1.
Multiple Choice
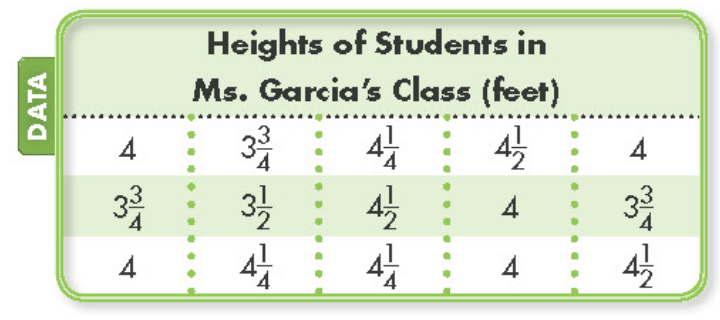
Which is the most common height in this class?
4
3 3/4
4 1/4
4 1/2
2.
Multiple Choice
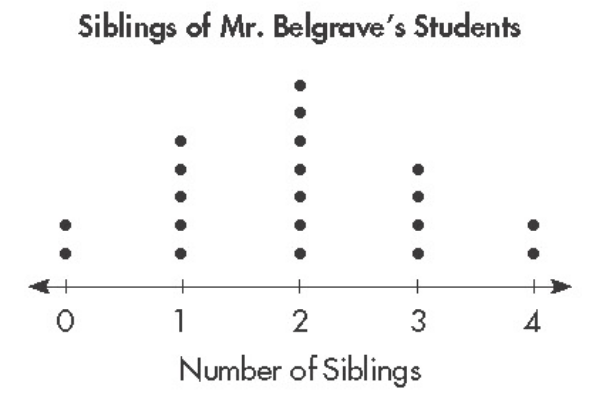
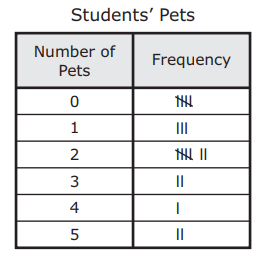
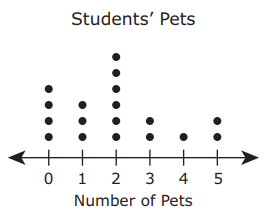
What number of siblings is most common in this class?
0
1
2
3
4
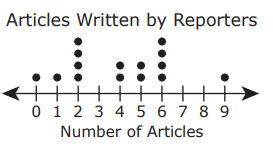
3.
Multiple Choice
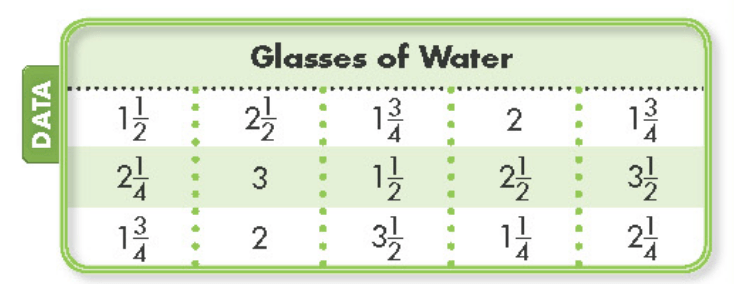
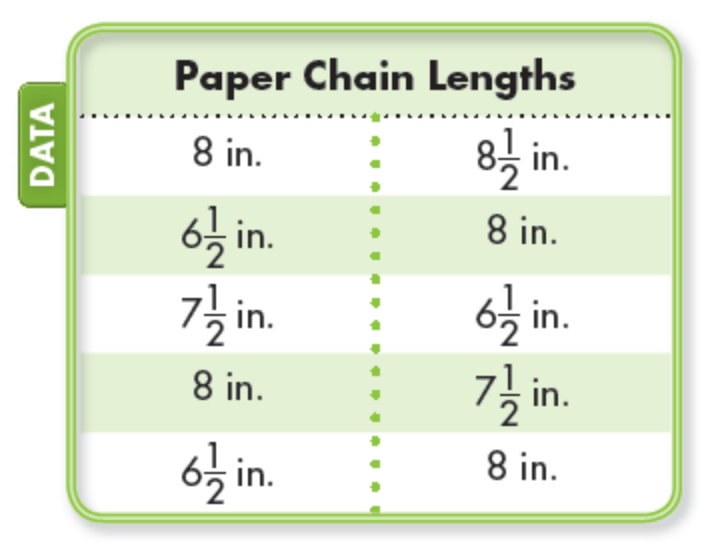
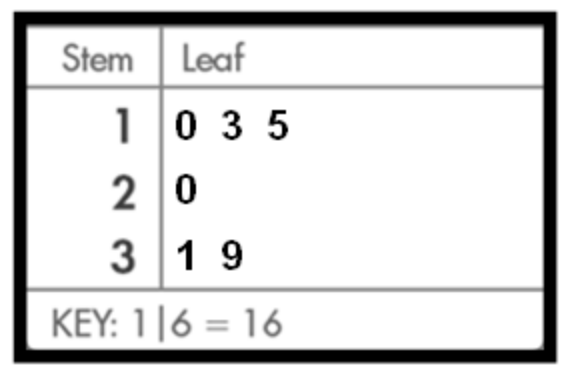
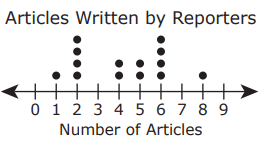
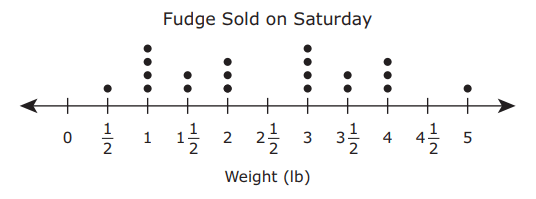
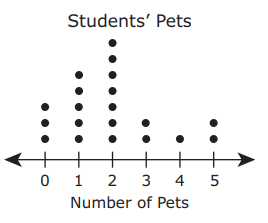
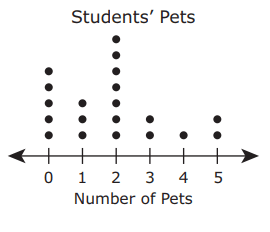
If a dot plot were used to represent this data, how many dots would be placed above 1 3/4?
3 dots
2 dots
1 dot
0 dots
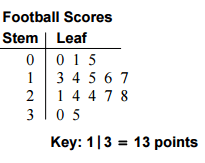
4.
Multiple Choice
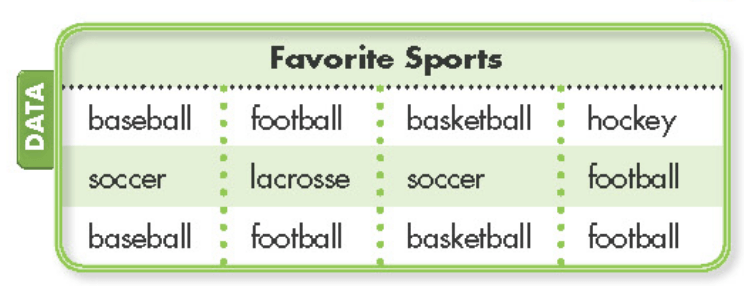
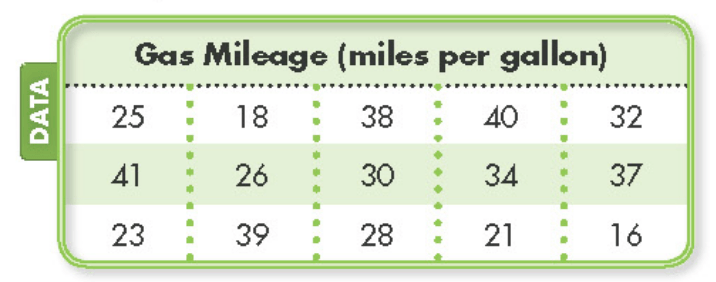
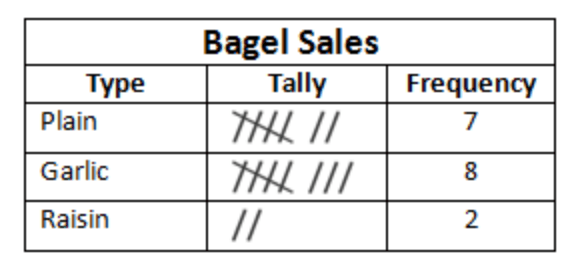
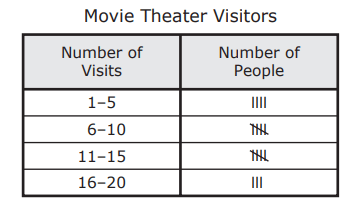
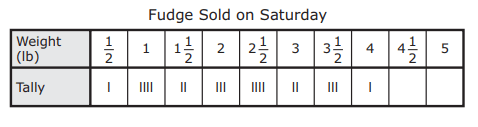
If a frequency table were used to represent the data, how many tally marks would there be for football?
1
3
4
5
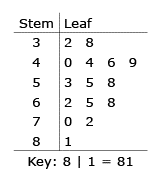
5.
Multiple Choice
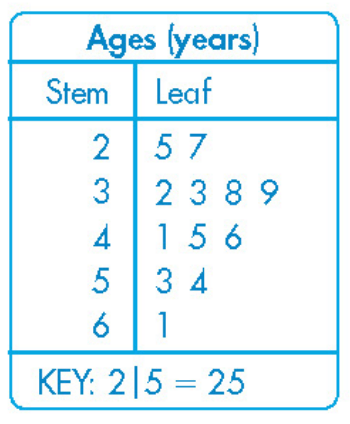
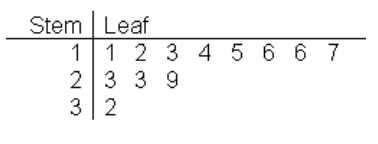
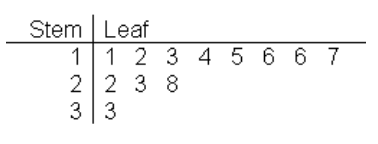
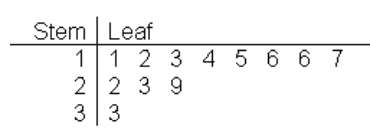
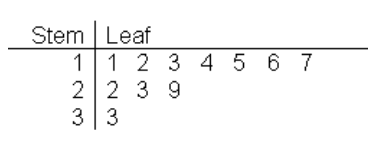
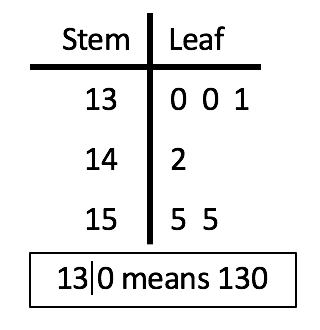
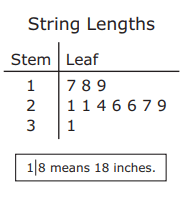
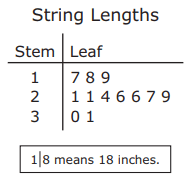
The members of a soccer club represent a wide range of ages. Using the stem and leaf plot, how many members are in the soccer club?
4
5
8
12
6.
Multiple Choice
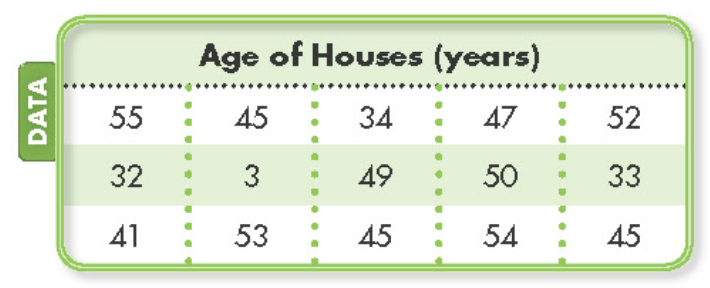
Which age is an outlier?
55
50
32
3


Explore this activity with a free account
Find a similar activity
Create activity tailored to your needs using

Box and Whisker Plots
•
6th - 8th Grade
Box and Whisker Plots
•
9th - 12th Grade
Box Plots
•
9th - 10th Grade
Histograms
•
6th Grade
Mean, Median, Mode, Box and Whisker
•
9th - 12th Grade
Levels of Measurements
•
11th Grade - University
Dot Plots
•
4th Grade
Analyzing Histograms
•
9th Grade