No student devices needed. Know more
20 questions
Pete's score was below the median.
Pete did worse than about 63% of the test takers.
Pete did worse than about 73% of the test takers.
Pete did better than about 63% of the test takers.
Pete did better than about 73% of the test takers.
0
1
2
3
5
5.64, 1.44
5.64, 1.32
5.40, 1.44
5.40, 1.32
5.64, 1.20
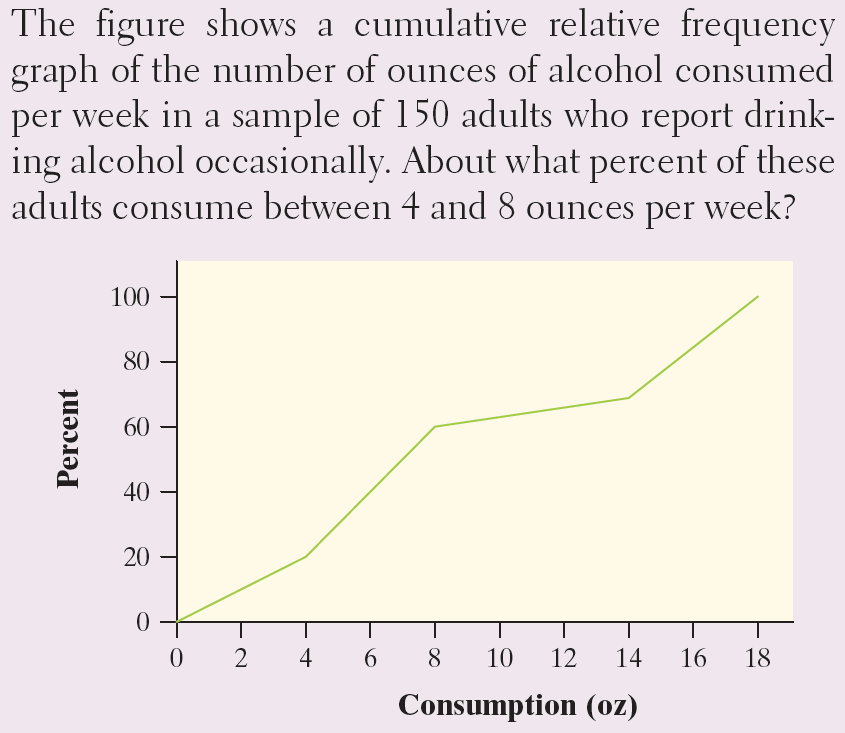
20%
40%
50%
60%
80%
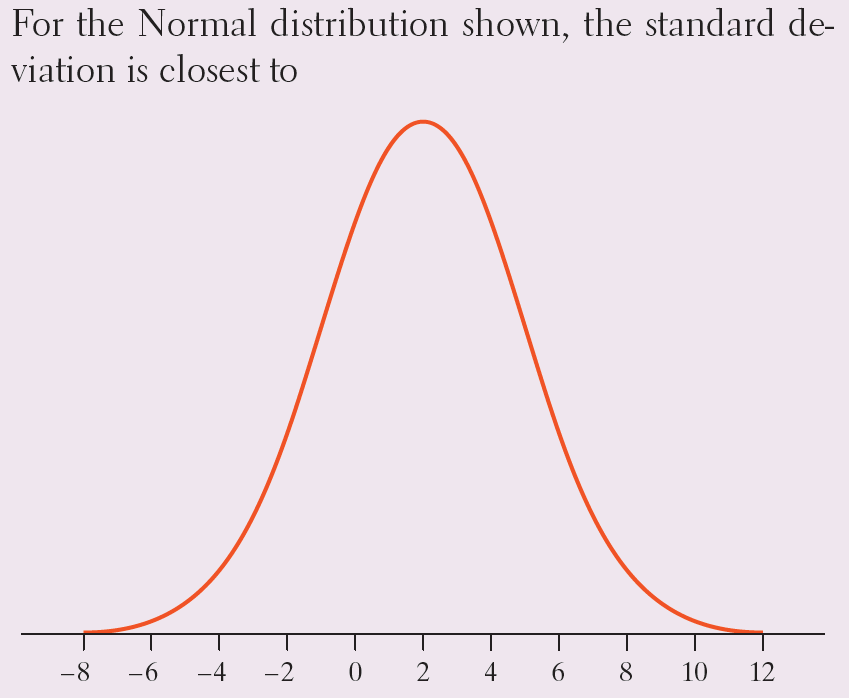
4.83 inches
5.18 inches
6.04 inches
8.93 inches
The standard deviation cannot be computed from the given information.
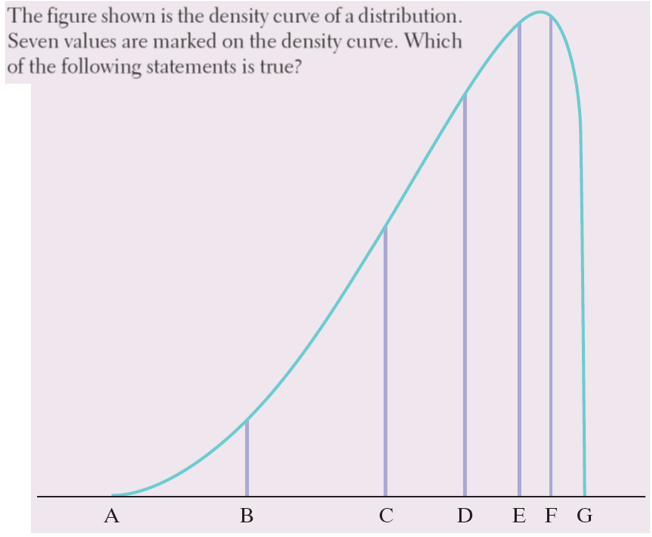
The mean of the distribution is E.
The area between B and F is .50.
The median of the distribution is C.
The 3rd quartile of the distribution is D
The area under the curve between A and G is 1.
1" (inch)
3" (inches)
4" (inches)
6" (inches)
12" (inches)
The distribution of the time it takes for different people to solve a certain crossword puzzle is strongly skewed to the right with a mean of 30 minutes and a standard deviation of 15 minutes. The distribution of z-scores for those times is:
Normally distributed with mean 30 and SD 15
skewed to the right with mean 30 and SD 15
Normally distributed with mean 0 and SD 1
skewed to the right with mean 0 and SD 1
skewed to the right, but the mean and standard deviation cannot be determined without more information
The EPA requires that the exhaust of each model of motor vehicle be tested for the level of several pollutants. The level of oxides of nitrogen (NOX) in the exhaust of one light truck model was found to vary among individual trucks according to an approximately Normal distribution with mean μ = 1.45 grams per mile driven and standard deviation σ = 0.40 gram per mile. Which of the following best estimates the proportion of light trucks of this model with NOX levels greater than 2 grams per mile?
0.0228
0.0846
0.4256
0.9154
0.9772
Until the scale was changed in 1995, SAT scores were based on a scale set many years ago. For Math scores, the mean under the old scale was 470 and the standard deviation was 110. In 2016, the mean was 510 and the standard deviation was 103. Gina took the SAT in 1994 and scored 500. Her cousin Colleen took the SAT in 2016 and scored 530. Who did better on the exam, and how can you tell?
Colleen - she scored 30 points higher than Gina.
Colleen - her standardized score is higher than Gina's.
Gina - her standardized score is higher than Colleen's.
Gina - the standard deviation was larger in 2016.
The two cousins did equally well - their z-scores are the same.
Which of the following is not correct about a standard Normal distribution?
The proportion of scores that satisfy 0 < z < 1.5 is 0.4332.
The proportion of scores that satisfy z < -1.0 is 0.1587
The proportion of scores that satisfy z > 2.0 is 0.0228
The proportion of scores that satisfy z < 1.5 is 0.9332
The proportion of scores that satisfy z > -3.0 is 0.9938
Jorge's score on Exam 1 in his statistics class was at the 64th percentile of the scores for all students. His score falls
between the minimum and first quartile
between the first quartile and the median
between the median and the third quartile
between the third quartile and the maximum
at the mean score for all students
When Sam goes to a restaurant, he always tips the server $2 plus $10% of the cost of the meal. If Sam's distribution of meal costs has a mean of $9 and a standard deviation of $3, what are the mean and standard deviation of his tip distribution?
$2.90, $0.30
$2.90, $2.30
$9.00, $3.00
$11.00, $2.00
$2.00, $0.90
Scores on the ACT college entrance exam follow a bell-shaped distribution with mean 21 and standard deviation 5. Wayne's standardized score on the ACT was -0.6. What was Wayne's actual ACT score?
3
13
16
18
24
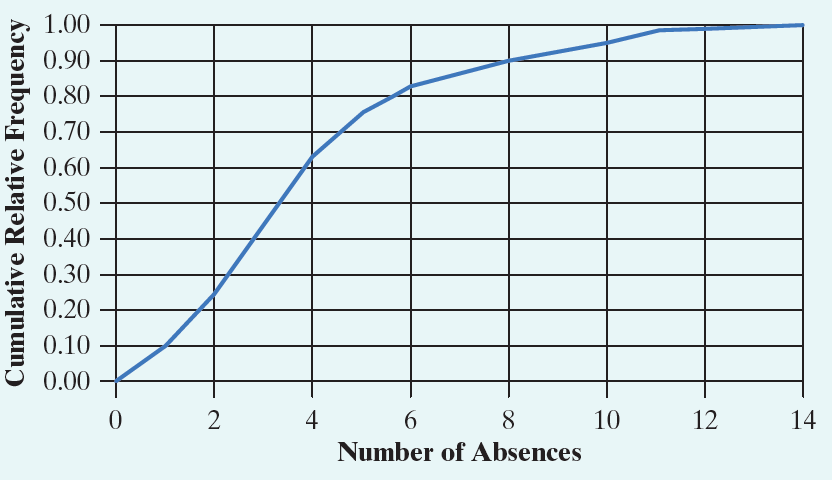
The number of absences during fall semester was recorded for each student in a large elementary school. The distribution of absences is displayed in the following cumulative relative frequency graph. What is the IQR for the distribution of absences?
1
2
3
5
1
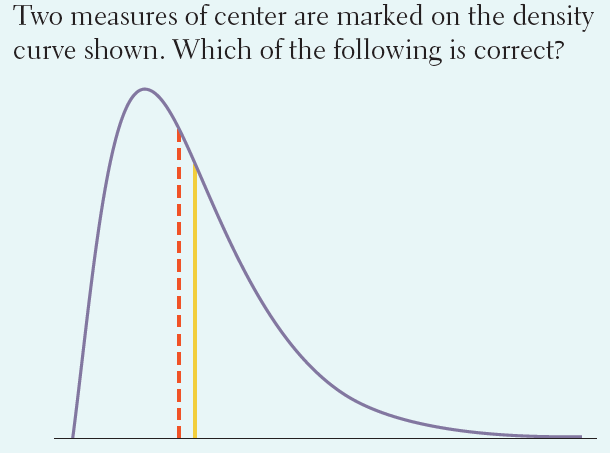
The median is at the yellow line and the mean is at the red line
The median is at the red line and the mean is at the yellow line
The mode is at the red line and the median is at the yellow line
The mode is at the yellow line and the median is at the red line
The mode is at the red line and the mean is at the yellow line
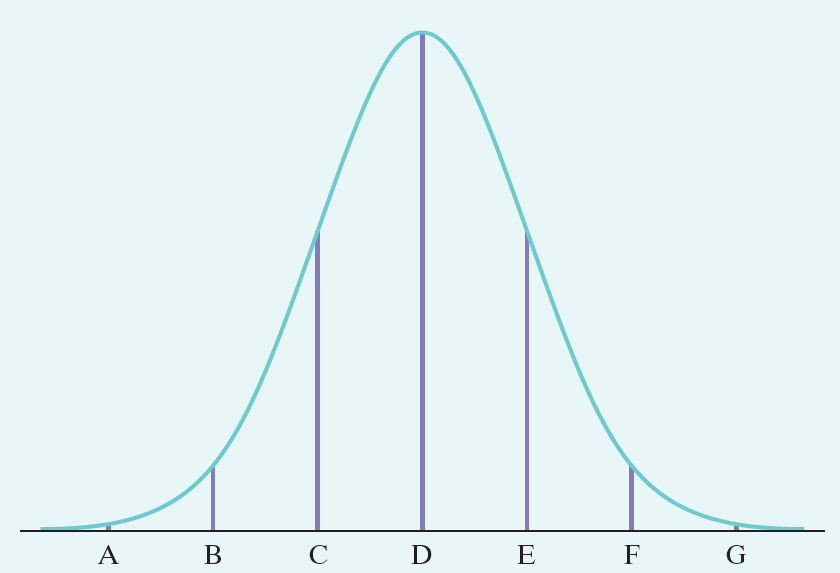
The weights of laboratory cockroaches follow a Normal distribution with mean 80 grams and standard deviation 2 grams. The following figure is the Normal curve for the distribution of weights. Point C on this Normal curve corresponds to
84 grams
82 grams
78 grams
76 grams
74 grams
The weights of laboratory cockroaches follow a Normal distribution with mean 80 grams and standard deviation 2 grams. The following figure is the Normal curve for the distribution of weights. About what percent of the cockroaches have weights between 76 and 84 grams?
99.7%
95%
68%
47.5%
34%
About what proportion of the cockroaches will have weights greater than 83 grams?
0.0228
0.0668
0.1587
0.9332
0.0772
A different species of cockroach has weights that are approximately Normally distributed with a mean of 50 grams. After measuring the weights of many of these cockroaches, a lab assistant reports that 14% of the cockroaches weigh more than 55 grams. Based on this report, what is the approximate standard deviation of weight for this species of cockroaches?
4.6
5.0
6.2
4.0
Cannot determine without more information
Explore all questions with a free account