IGCSE Coordinated Chemistry Workout 18
Assessment
•

Dave Gould
•
Chemistry
•
9th - 10th Grade
•
10 plays
•
Medium
Improve your activity
Higher order questions
Match
•
Reorder
•
Categorization
.svg)
actions
Add similar questions
Add answer explanations
Translate quiz
Tag questions with standards
More options
10 questions
Show answers
1.
Multiple Choice
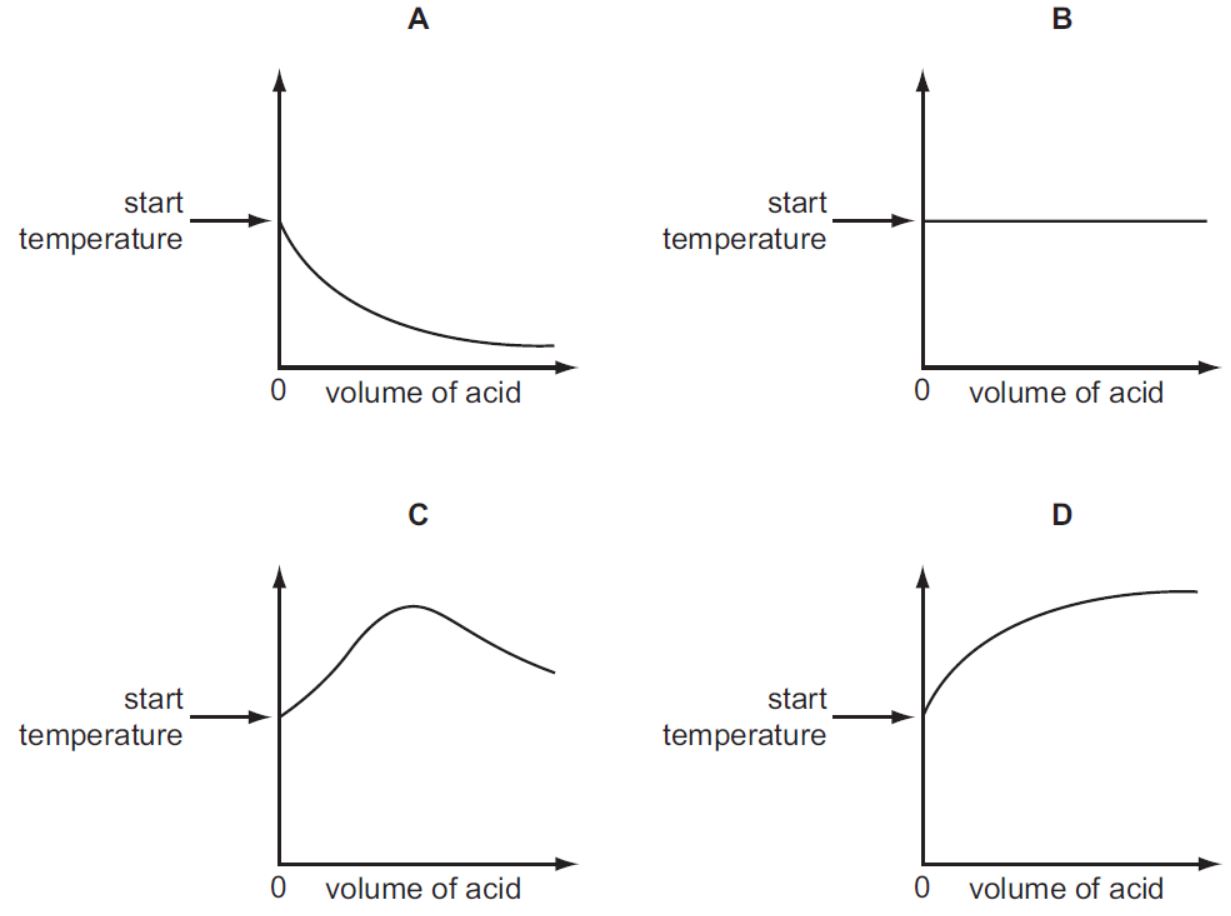
An acid is added to an alkali until the final solution is just neutral. The reaction is exothermic.
Which graph shows how the temperature changes as the acid is added to the alkali?
A
B
C
D
2.
Multiple Choice

The diagram represents the arrangement of atoms in a molecule of a compound.
What is the molecular formula of the compound?
CH2
C3H6
C3H8
C6H3
3.
Multiple Choice
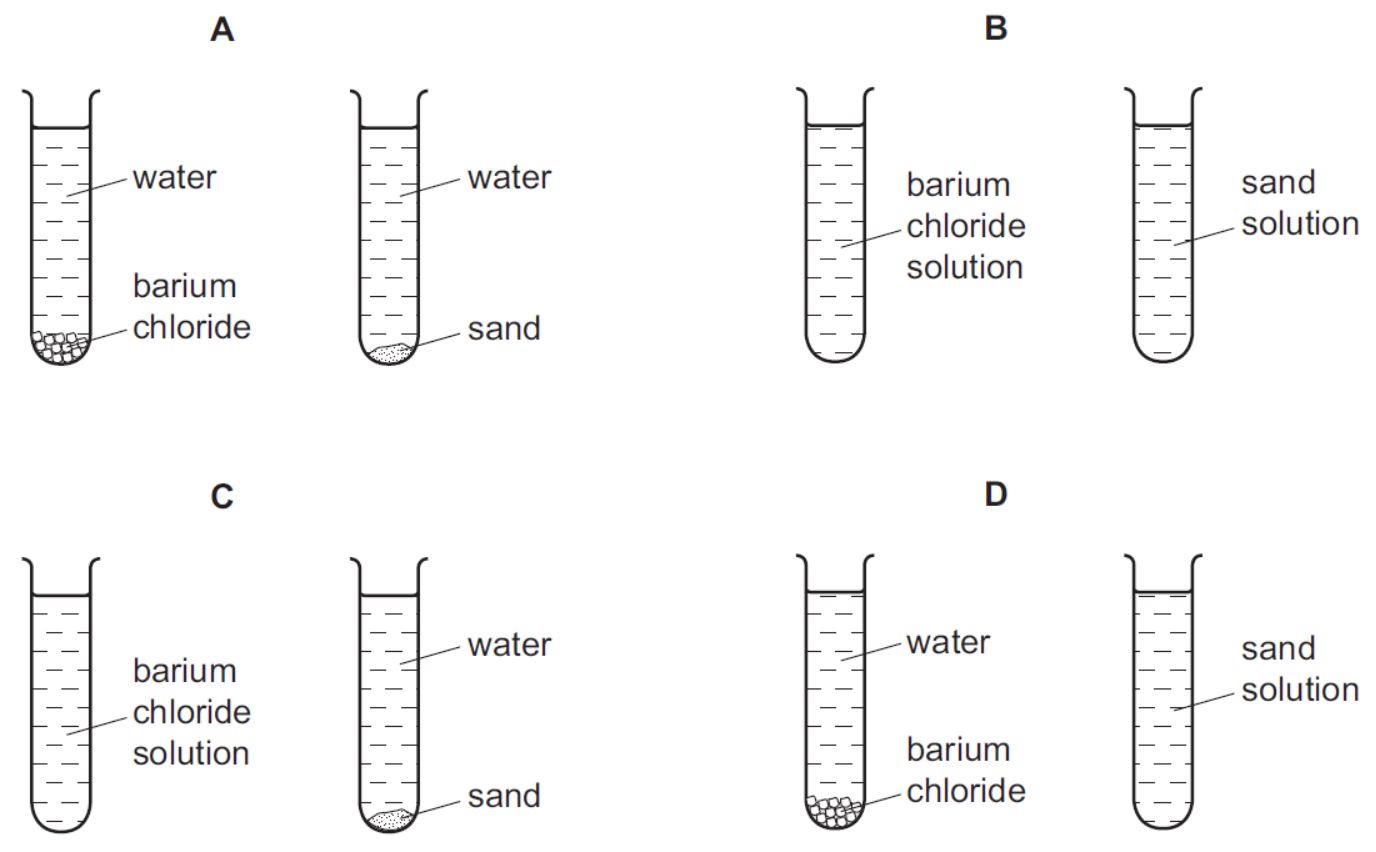
Small amounts of barium chloride and sand are shaken with separate samples of water in two test-tubes. The test-tubes are left to stand for 24 hours.
Which diagram shows how the test-tubes appear at the end?
A
B
C
D
4.
Multiple Choice
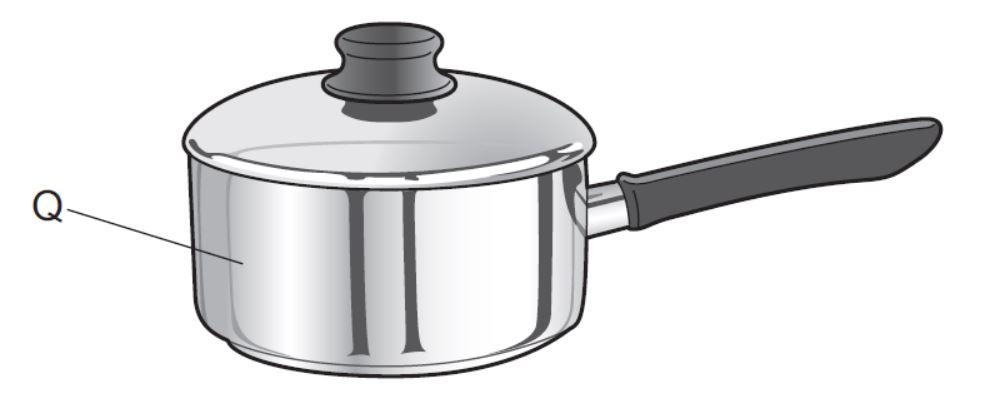
Substance Q is used to make a cooking pan. What are the properties of substance Q?
high melting point and high thermal conductivity
high melting point and low thermal conductivity
low melting point and high thermal conductivity
low melting point and low thermal conductivity
5.
Multiple Choice
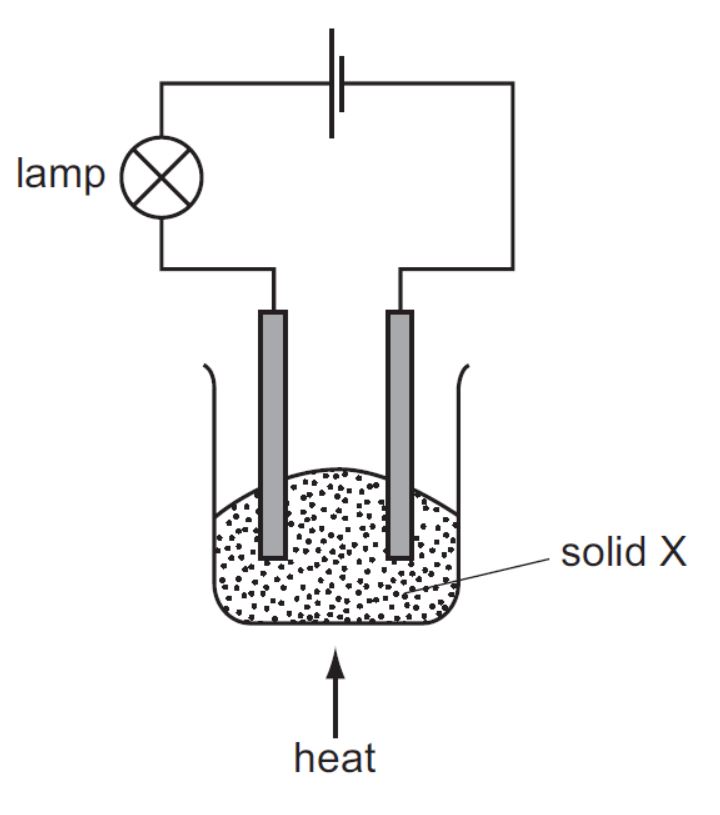
The experiment shown is used to investigate the properties of solid X. At first, the lamp does not light. On heating, solid X melts and the lamp lights.
What type of substance is X?
a compound of a metal and a non-metal
a compound of two non-metals
a metallic element
a non-metallic element
6.
Multiple Choice
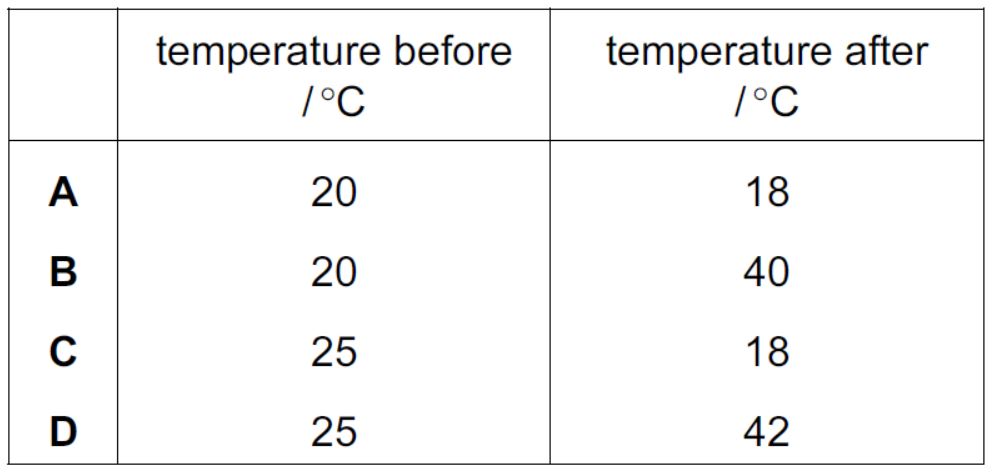
The table shows the temperature of some water before and after a solid is dissolved in it.
Which change is the most exothermic?
A
B
C
D

Explore this activity with a free account
Find a similar activity
Create activity tailored to your needs using
.svg)

Molar Mass
•
10th Grade - University

Naming Ionic Compounds
•
9th - 11th Grade

Naming Compounds
•
7th - 9th Grade

Naming Compounds
•
10th - 11th Grade

Chemical Reaction and Equation
•
10th Grade

Element Symbols and Names
•
8th - 12th Grade

Ionic Bonding
•
8th - 12th Grade

Electronic Configurations
•
5th Grade
