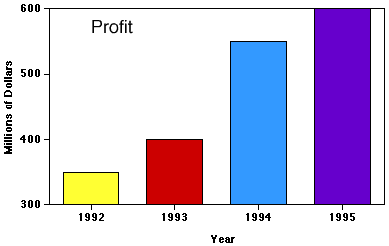
Bar Graphs, Circle Graphs, and Dot Plots
Assessment
•
•
Mathematics
•
6th - 8th Grade
•
1 plays
•
Hard
Improve your activity
Higher order questions
Match
•
Reorder
•
Categorization
.svg)
actions
Add similar questions
Add answer explanations
Translate quiz
Tag questions with standards
More options
11 questions
Show answers
1.
Multiple Choice
15 mins
1 pt

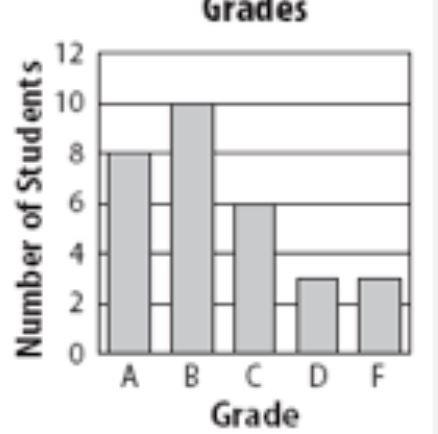
How many students take the bus to school?
35
20
10
15
2.
Multiple Choice
30 sec
1 pt
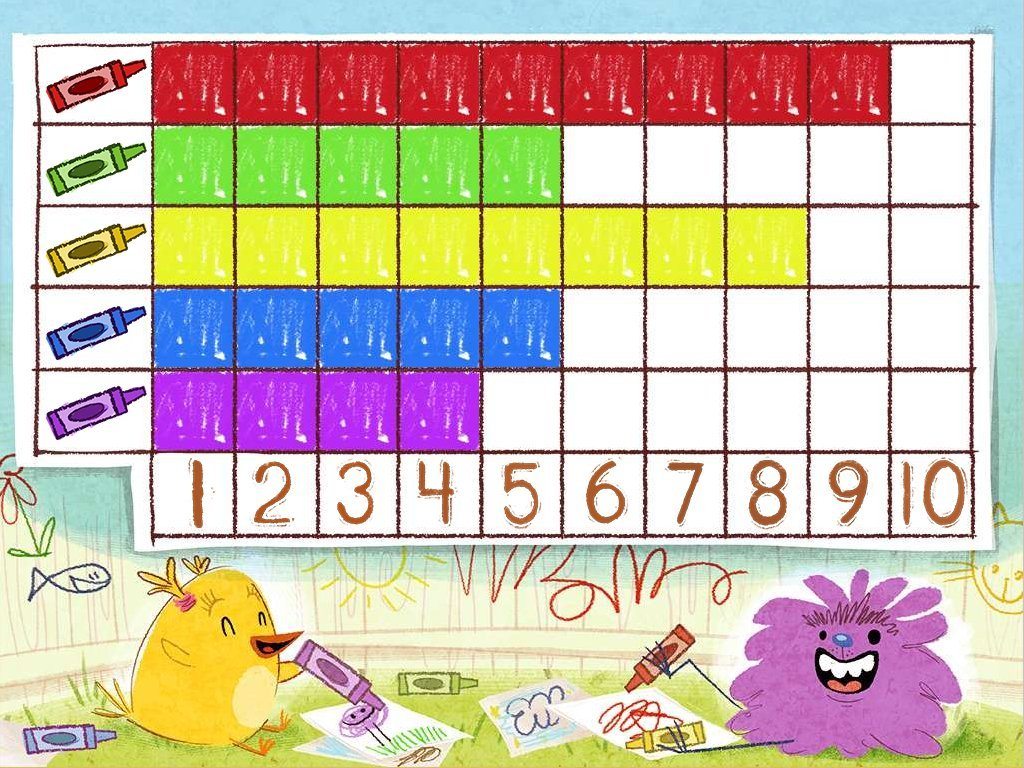
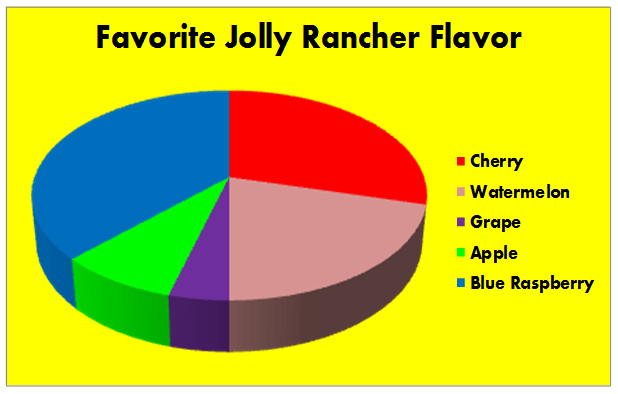
How many more people like red than purple?
100
10
2
5
3.
Multiple Choice
15 mins
1 pt

How many more people like red than purple?
100
10
2
5
4.
Multiple Choice
1 min
1 pt
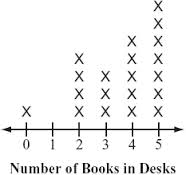
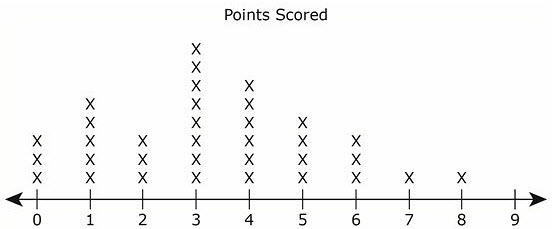
How many people have two or less books in their desk?
4
5
6
7
5.
Multiple Choice
15 mins
1 pt

How many more people have purple for a favorite color than red?
3
5
7
9
6.
Multiple Choice
30 sec
1 pt
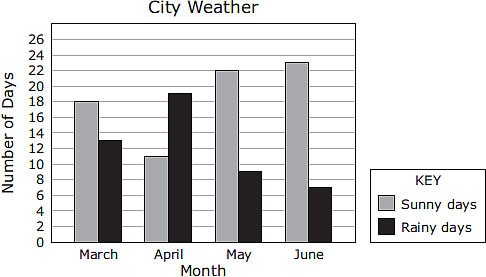
The graph below shows the number of sunny days and rainy days in a city during four months.
Based on the graph,how many more sunny days than rainy days did this city have during the months of April, May, and June?
Based on the graph,how many more sunny days than rainy days did this city have during the months of April, May, and June?
21
56
26
20

Explore this activity with a free account
Find a similar activity
Create activity tailored to your needs using
.svg)

20 questions
Multiplication
•
3rd - 5th Grade

12 questions
Time
•
3rd - 4th Grade

20 questions
Time, Multiplication and Division
•
3rd Grade

9 questions
Addition
•
1st Grade

11 questions
Line Plots
•
5th - 8th Grade

13 questions
Substraction
•
KG

10 questions
Sorting
•
KG

5 questions
Numbers Recap
•
KG
